 To understand why some parts of Philadelphia continue to struggle to attract investment in businesses it is critical to know about the city’s history of redlining and segregation. “Redlining” was the practice of barring lending in certain areas of cities based not just on the physical factors of the neighborhood and its housing stock, but on the race, nationality, and economic class of its residents.
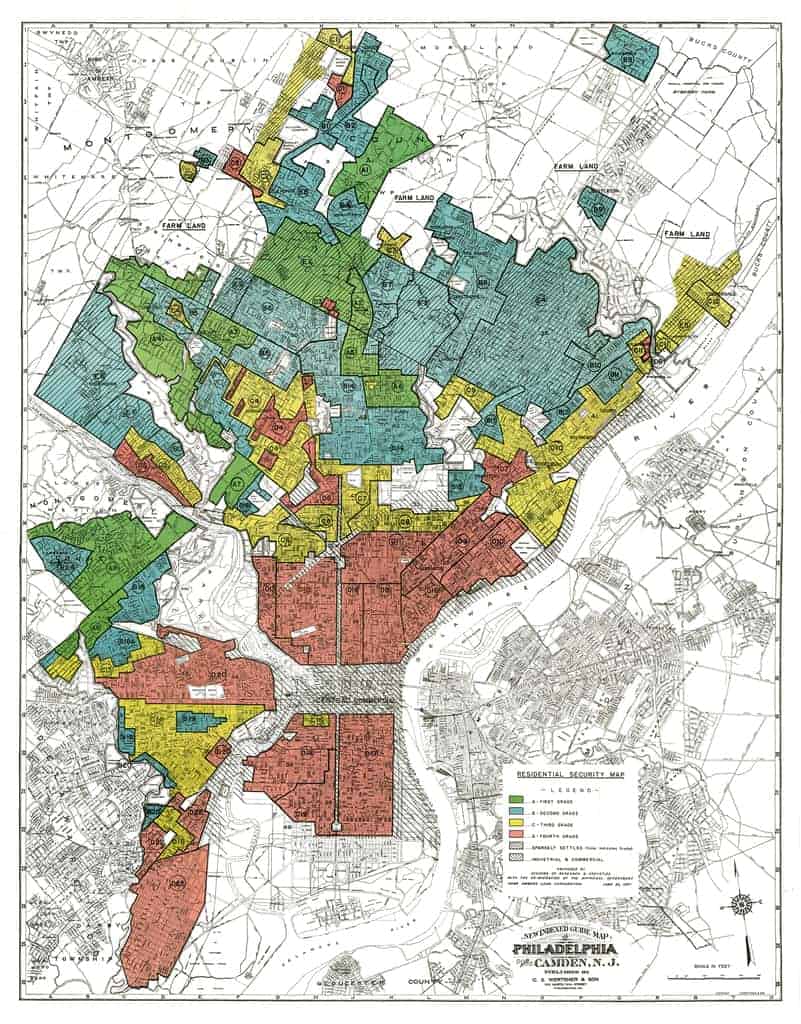
The “Residential Security” maps provide a color coded record of neighborhoods that were judged too “hazardous” for lending. As this 1937 map of Philadelphia shows, large portions of the city center were identified with red, resulting in decades of disinvestment for these neighborhoods. But how have the effects of redlining come to impact neighborhoods today?
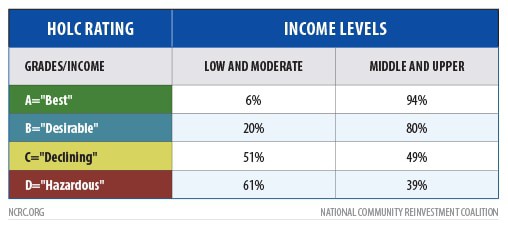
A study by NCRC of neighborhood economic conditions today showed that many areas that were redlined 70 years ago are at the bottom of the income scale today. In Philadelphia that means:
- 61% of redlined areas from the 1930s still struggle economically;
- 94% of the neighborhoods that were not redlined are still upper income;
- Most of the redlined neighborhoods are minority majority today;
 Small business lending in Philadelphia reflects these effects, with redlined neighborhoods receiving 20% fewer business loans between 2012 and 2016. Those loans they did receive were much smaller than those in non-redlined areas. In 2018, the landscape of disinvestment defined by redlining still throttles the growth of businesses and entrepreneurs in Philadelphia today.
