Defining Hispanic and Latino
In census data, Hispanic is the term most often used to describe the ethnicity of the people in the United States from Spanish speaking countries. However, it is most often thought of as a person from or has ancestry in Latin America, excluding people from Spain.
The term Latino, shorthand for “Latinoamericano,” refers to any individual born or descendant from countries in the Americas (including the Caribbean) that widely speak Latin-based languages such as Spanish in Mexico, French in Haiti or Portuguese in Brazil. In this publication, we use the term Latino because of our focus on people from Latin America. Yet, the data we share most often solely derives from people born in or have ancestry from Latin American Spanish speaking countries, most often excluding Haitians and Brazilians.
Demographics
Latinos are the largest and second-fastest-growing community of color in the United States. The Latino population has an 84% growth rate, tailing Asian Americans with a 96% growth rate. According to the US Census, the Latino population reached 58.8 million people as of 2017. Estimates from the Census’s American FactFinder indicate that 63% of Latinos are of Mexican descent, 9.5% are Puerto Rican, 3.8% are Salvadoran, 3.7% are Cuban, 3.3% are Dominican and 2.4% are of Guatemalan origin. Many Latinos tend to reside in California, Texas, Florida and New York. California alone has a population of 15.5 million Latinos (26%), the highest in the United States, followed by Texas with 11.4 million (19%), Florida with 5.5 million (9.45%) and New York with 3.7 million (6.25%).
Income
The United States’ Latino population is growing, and to this day, it is still one of the most socioeconomically insecure. In 2017, Latino households had a median income of $49,793, about 20% less than the national median, which is $60,336. This income difference illustrates $9,000 more than African American median income ($40,232) and $19,00 less than White median income ($65,845).
When comparing the individual income of foreign vs. native-born Latinos, we find a surprising result. The foreign-born Latinos’ individual median income from the start of the Great Recession in 2007 throughout recovery in 2017 rose 17% ($24,200-$28,300). Meanwhile, native-born Latinos’ individual median income has seen a loss of 6% ($32,000-30,000).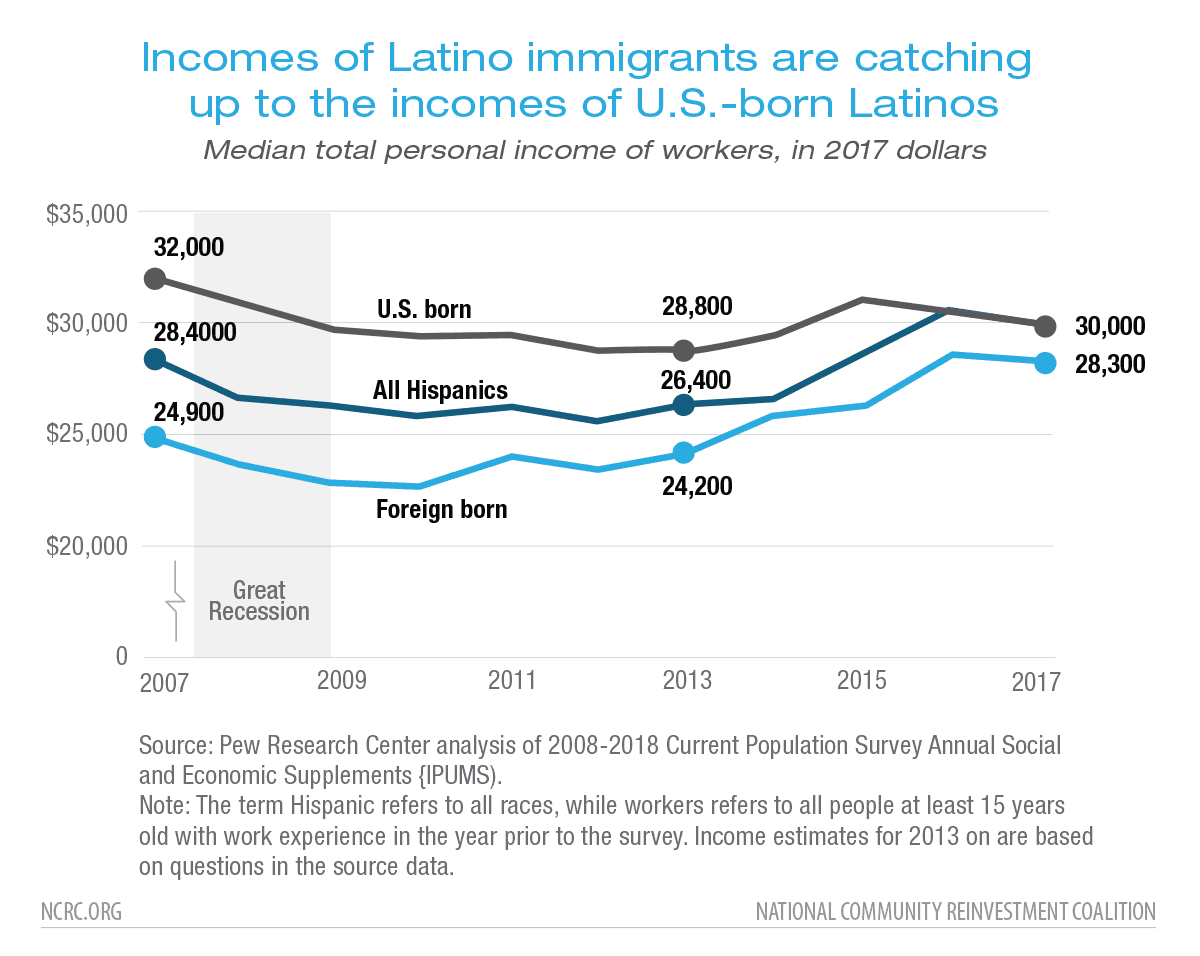
Poverty Rates
The poverty rate for Latinos decreased from 23.2% in 2008 to 18.3% in 2017. The poverty rate for non-Hispanic White Americans is only 8.7%, less than half the poverty rate of Latinos. For almost 40 years, the Latino poverty rate has consistently hovered around 20%, with a 1980 poverty rate at 25.7%, 22.3% in 1990, 21.2% poverty rate in 2000, and 18.3%in 2017.
Employment and Unemployment
The Latino unemployment rate fluctuates in a downward projection from 5.8% to 4.3% in-between the period of January 2017 to June 2019. Meanwhile, the national average unemployment rate progressively drops to about 3.7%. The Bureau Of Labor Statistics 2018 data show that native-born Latinos have an unemployment rate of 5.5%, whereas foreign-born Hispanic/Latino/a’s have a lower rate of 3.8%. The reason for the difference in employment rates between foreign-born and native-born Latino individuals is unclear though there is growing research in this area. Considering labor participation, White Americans sit right above the national average with 62.3% participation, while Latino and Black Americans participate at a rate of 65.8% and 61.6%, respectively.
Latinas and Gender Inequality
Beginning with educational attainment, Latinas hold more bachelor’s degrees or higher (17.6%) compared to male Latino’s (14.4%). However, Latinas still do not earn as much as Latino men. According to census data, Latinas have a median income of $31,364 versus $36,568 earned by Latino males. According to 2017 data from the American Community Survey (ACS), 5.01% of Latinas are unemployed, and women lead about 22.8% of Latino households. By comparison, 6.78% of African American women are unemployed, and women lead 37.7% of African American households. Asian women have a 3.06% unemployment rate, and 10.5% of Asian households are women-led. White women have a 2.8% unemployment rate and 11.6% of White women led households.
Educational Achievement
Latinos have the lowest attainment of bachelor’s degrees or higher. According to 2017 data from the American Community Survey (ACS), only about 16% of Latinos had a bachelor’s or higher. In contrast, 35.8% of Whites had a bachelor’s degree or higher, 21.4% of African Americans and 53.8% of Asian Americans had the same.
Foreign-born Latinos had a higher proportion of adults with less than a high school education at 28% compared to native-born Latinos at 8%. Interestingly, foreign-born Latinos were just as likely as the native population to hold an advanced degree: 13% versus 12%.
Debt, Inheritance, Wealth & Homeownership
In 2016, the wealth of a Latino household was only $6,300 compared to White Americans, who held $140,500. In terms of wealth, single Latinas, between the ages of 18 to 64, have a median wealth of only $100, about a tenth of that of Latino men and not even half of 1% of the wealth of White men.
However, in 2015, Latinos accounted for some of the highest increases in homeownership – 69% of the net growth in the U.S. Currently, about 46% of Hispanic Americans own a home. Nevertheless, Latino’s still lag behind White Americans, 72% of whom own a home. Latino homeownership is slightly higher than that of African Americans, which is 40%.
This wealth disparity corresponds with a strong inheritance disparity. Only 5% of Hispanic and Latino’s reported receiving a type of monetary or estate inheritance, while 26% of Non-Hispanic Whites claim such financial background.
Latino households’ carry-on a lower median debt value in comparison to other demographic populations. Latino households’ own a median debt of $30,000, Black households own a debt of $31,400, and White families possess the highest debt at $74,100. This example illustrates the wealth disparity in the United States is based on assets rather than pending liabilities. Though Latinos carry lower levels of debt, Latinos have to apply a higher portion of their lower-income towards debt payment.
Dedrick Asante-Muhammad, Chief of Race, Wealth and Community, NCRC
Diego Hernandez, Intern, Race, Wealth and Community, NCRC
