
When the Consumer Finance Protection Bureau (CFPB) released the 2018 Home Mortgage Disclosure Act (HMDA) data, it included a slew of new information on mortgage loan applications made by lenders in the United States. Among the new variables are exciting details on the interest rates and closing fees paid by most borrowers. In our preliminary analysis, one of the startling revelations is just how much more mortgage companies charge borrowers than banks do.
In 2018, the combined value of closing fees and mortgage interest over the life of the loan was just under $1.5 trillion1. This is the amount that borrowers in 2018 will pay overtime for the loans they needed to own a home. These costs are important. Higher fees and interest rates mean the amount of wealth you can expect to build in your home is lower. If you are selling, the price you sell it for is held in check by these costs.
Economists with the Federal Reserve released a study in March using the new National Mortgage Database where they looked at the prices different borrowers pay for their loans. What they found was that all lower-income borrowers, first-time buyers and people with less financial literacy paid substantially more for their mortgages regardless of credit score or other underwriting criteria. However, even though loan prices are expected to vary to a degree based on the amount borrowed, the downpayment and the credit history of the borrower in the new HMDA data highlights how much more they pay if they use a mortgage company instead of a bank to get their loan.
Regulated by the Community Reinvestment Act (CRA), banks are expected to meet the credit needs of the entire community in which they operate. In low- and moderate-income (LMI) communities, the CRA is responsible for as much as 20% of mortgage and business lending. Since the end of the Great Recession, large banks have reduced their lending to LMI borrowers, a move largely driven by their exit from Federal Housing Administration (FHA) lending. It must be noted that the typical bank is still making a greater percentage of their loans to LMI people and census tracts than non-banks. However, any meaningful CRA reform needs to encourage large banks to get back into the LMI home lending marketplace.
About $1.2 trillion in the interest and fees generated by mortgage lending in 2018 came from owner-occupied home purchase, refinance and home improvement lending. Without large and accessible banks to borrow from, most LMI borrowers go to mortgage companies for their home loans. In 2018, almost 625,000, more than 60%, of LMI borrowers bought a home with a loan from a mortgage company. For minority borrowers, they are even more reliant, with 64% in 2018 using a mortgage company to finance their purchase.
The premium that those buyers paid is high. The average interest rate for banks was 4.68%, while mortgage companies charged 4.92%. And while banks charged an average of $5,583 to close on a loan, mortgage companies collected $7,430 on average for each borrower.

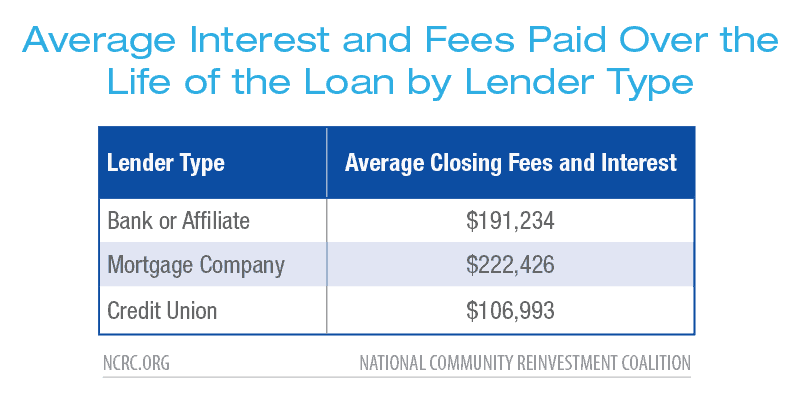
The impact of higher loan costs on these borrowers is dramatic. Borrowers that secured a home purchase, refinance or home improvement loan through a mortgage company are paying a total in interest and fees of $222,426 on average. This is $31,192 more than bank borrowers paid, and $115,433 more than credit union borrowers.
With 2,996,940 loan originations in 2018, mortgage companies collected $93,480,552,480 more in fees and interest than they would have had they charged consumers the same closing costs and interest rates that banks did.2 The share of that amount paid by LMI borrowers was $39 billion. The average LMI borrower paid $152,352 when they went to a mortgage company compared to just $109,137 at a bank. That is a premium of over $43,000 that LMI families will pay over the life of their loans.
A $90 billion premium comes out of the equity that we all pay. Higher fees make it harder for renters to become homeowners. They erode the price a seller can expect to receive for their home. This is a bill that falls disproportionately on LMI and minority families, one the reinforces the growing racial and income wealth gaps.
Properly enforced, the Community Reinvestment Act (CRA) requires banks to serve their entire community consistently with safety and soundness, and an expanded CRA could require the same of mortgage companies. Massachusetts’ CRA law is applied to mortgage companies and thus serves as an important precedent. The current price difference is driven in part by the split mortgage market; LMI families are served by mortgage companies while large banks focus more on wealthier, and whiter, borrowers.
Separate markets are not equal. When 98% of banks pass their CRA exams and very large banks are most likely to get the highest ratings, with the largest ones examined only every five or six years instead of the industry standard of two or three years, those same banks won’t make the loans that LMI borrowers need. Without other options, LMI families are getting fleeced by the only lenders that will service them.
Jason Richardson is NCRC’s Director of Research and Evaluation.
Photo from ©Pixel-Shot

- This is derived from all loans in the dataset. Unless otherwise noted, the figures used throughout the rest of this paper are based on forward originations on site built homes with 1-4 units. Loans covered by the partial exemption to collect price and other data are excluded.https://www.consumerfinance.gov/policy-compliance/rulemaking/final-rules/partial-exemptions-from-requirements-of-home-mortgage-disclosure-act-under-regulation-c/
- APY and loan costs were calculated using the methods described here. https://ncrc.org/ncrcs-hmda-2018-methodology-how-to-calculate-loan-price/ The average APY and closing costs were calculated and used to derive a total interest and fees amount by adding the total interest and fees for all originations made by each class of lender. Those figures were then divided by the total number of originations to produce an average of the total interest and fees for each lender type.