fbpx

redlining and neighborhood health

Image courtesy of Nathaniel Ayers, Digital Scholarship Lab, University of Richmond

— OVERVIEW

There is a higher prevalence of COVID-19 risk factors in historically “redlined” neighborhoods 

— Key Takeaways

For decades, starting at least in the 1930s, low-income and minority communities were intentionally cut off from lending and investment through a system known as redlining.

Today, those same neighborhoods suffer not only from reduced wealth and greater poverty, but from lower life expectancy and higher incidence of chronic diseases that are risk factors for poor outcomes from COVID-19.

Housing, economic and social policies should aim to eliminate those risks and undo the unfair burdens of structural racism, both past and present.

— Key Findings

Greater historic redlining is related to current neighborhood characteristics, including increased minority presence, higher prevalence of poverty and greater social vulnerability.

There are statistically significant associations between greater redlining and general indicators of population health, including increased prevalence of poor mental health and lower life expectancy at birth.


There are statistically significant associations between greater redlining and pre-existing conditions for heightened risk of morbidity in COVID-19 patients like asthma, COPD, diabetes, hypertension, high cholesterol, kidney disease, obesity and stroke.

Differences in life expectancy vary greatly among cities: from 14.7 years less in redlined neighborhoods of Rochester, Minnesota, to a 1.3 year greater life expectancy in redlined neighborhoods of Ogden, Utah, which has experienced considerable growth and urban development since 1940.

— Key Recommendations

Restore the Affirmatively Further Fair Housing (AFFH) rule that President Trump and Secretary of Housing Ben Carson have cancelled. This rule encouraged communities to identify and reduce concentrated areas of poverty.

Support inclusionary zoning that adds affordable housing choices outside of the redlined sections of the city and promotes the reduction of concentrated areas of poverty.

Expand the Community Reinvestment Act (CRA) to include non-banks and to modernize how this law is implemented.

Encourage locally relevant solutions such as expanded Section 8 and rent control/vouchers. Protect public housing.

Authors:

Jason Richardson, Director, Research & Evaluation, NCRC

Bruce C. Mitchell PhD., Senior Research Analyst, NCRC

Helen C.S. Meier, PhD, MPH, Assistant Professor of Epidemiology, University of Wisconsin - Milwaukee

Emily Lynch, MPH, Graduate Student Research Assistant, University of Wisconsin - Milwaukee

Jad Edlebi, GIS Specialist, NCRC

In collaboration with:

Robert K. Nelson, Director, Digital Scholarship Lab, University of Richmond

Justin M. Madron, GIS Project Manager & Analyst -Digital Scholarship Lab, University of Richmond

Executive Summary

The current COVID-19 public health crisis devastates both the economy and health of Americans. The burdens of this crisis are not shared equally, however. While communities across the nation have experienced tragic losses, the impacts have been especially hard-felt in low-income and minority communities.[1] [2] Hourly wage-earners, particularly people working in service-related industries, are more prone to sustain losses in income, or endure increased exposure to the virus.[3] [4] Lower-income Black and Hispanic communities, which have experienced disinvestment for decades, are especially hard-hit by the toll, and they are paying a high price in decreased opportunity and increased exposure to the disease.[5]  These communities are recognized as having high social vulnerability, meaning that they have a decreased capability to withstand natural and human-created disasters because of their more limited resources (Cutter, Boruff and Shirley, 2003). The federal governmental response to the virus makes these vulnerabilities more obvious. But how did low-income and minority communities become so vulnerable to disasters like the COVID-19 pandemic? Public health research aims to understand how historical processes have created and maintained social, economic and environmental conditions that give rise to poor health. A key concept from public health research involves pathways, which trace the history of social circumstances in places which create the health outcomes for communities that we see today. Many low-income Black and Hispanic communities with poor health outcomes are located in places which have been subject to decades of disinvestment. This history of disinvestment can be traced back to the early twentieth century when residential segregation was imposed in more formalized ways on cities throughout the country. This segregation was implemented using a variety of measures, including restrictive deeds and covenants, zoning regulations, public health codes, as well as officially sanctioned “redlining.” The impact of redlining, a practice that intentionally restricted investment in parts of American cities based largely on the race of the people that lived there, has been far reaching – defining the residential landscape of American cities today. This report examined redlined areas, and how they are associated with adverse public health outcomes for a range of diseases and conditions that make people particularly susceptible to the worst effects of COVID-19. Our findings indicate that:

  • Greater historic redlining is related to current neighborhood characteristics, including increased minority presence, higher prevalence of poverty and greater overall social vulnerability.
  • There are statistically significant associations between greater redlining and general indicators of population health including increased prevalence of poor mental health and lower life expectancy at birth.
  • There are statistically significant associations between greater redlining and pre-existing conditions for heightened risk of morbidity in COVID-19 patients like asthma, COPD, diabetes, hypertension, high cholesterol, kidney disease, obesity and stroke.
  • On average, life expectancy is lower by 3.6 years in redlined communities, when compared to the communities that existed at the same time, but were high-graded by the HOLC.

This paper is one of the first of its kind to examine historical redlining in cities across the nation on numerous present-day neighborhood health outcomes. The history of redlining, segregation and disinvestment not only reduced minority wealth, it impacted health and longevity, resulting in a legacy of chronic disease and premature death in many high minority neighborhoods. With the ongoing pandemic, the indication of greater risk factors for COVID-19 compounds the disparities in communities that have a history of redlining. Redlining and disinvestment are not only associated with greater segregation and economic inequality, but with the most basic attributes of public health, life expectancy and social vulnerability. 

— Other Views

Introduction

The United States developed a deeply segregated society, the results of which are evident in the separation of communities we see today. Urban areas are often starkly divided by income and race. These divisions circumscribe the choices available to individuals. Racial and economic residential segregation entwine in their impact on the opportunities and health of Black and Hispanic Americans. Economic segregation defines the availability and quality of services, amenities and educational and employment opportunities at the neighborhood level (Dreier et al., 2004). The adverse economic impacts are compounded by racial segregation in ways that systematically weaken social and economic opportunities, especially those of Black Americans (Massey and Denton, 1993). While there has been progress in removing some of the more overt examples of racial segregation, forty-two years after passage of the Fair Housing Act, residential segregation persists despite general preferences of Black and Hispanic Americans to reside in relatively racially integrated neighborhoods (Farley, 1993, 1997; Krysan & Farley, 2002; Charles, 2003).

In 2019, Black homeownership was lower than it was when segregation was legal.[6] Past sociological literature has examined a number of factors contributing to the persistence of residential segregation. Explanations include social attitudes resulting in discriminatory behavior (Galster, 1988; Massey and Denton, 1993; Yinger, 1995) and differences in socioeconomic status and housing prices (Muth, 1969; Clark, 1986). Quillian (2002) studied residential mobility among Blacks and Whites, attributing the continuation of racial residential segregation to a combination of White prejudice and discrimination in housing markets. These twin factors of discriminatory attitudes by White people against people of color and discrimination in housing markets are rooted in the history of the United States (Kendi, 2017). Our history has resulted in the development of the systemic and structural aspects of racial discrimination.

Systemic racial discrimination refers to the interlocking of racial disparities across multiple dimensions: residential location, education, employment and income, access to financial services and credit, justice, healthy food, a clean environment and quality of health services (Reskin, 2012). This interlocking system of disparities has a synergistic effect, making racial discrimination especially pernicious and difficult to eradicate through isolated policy solutions. The structural aspect of racial discrimination refers to its institutionalization in the public and private spheres in ways that are both intentional and unintentional (Pincus, 1996; Pager and Shepherd, 2008). An example of this is the persisting disparity in home mortgage loan approvals for Black and Hispanic applicants. While financial institutions disavow intentional discrimination by pointing to differences in credit histories, the creditworthiness of individual Black and Hispanic applicants has been impacted by systemic discrimination against the group, resulting in reduced educational and employment opportunities, lower incomes and less inherited wealth. Those factors impact the capability to attain a higher credit score. The continued denial of credit reinforces preexisting patterns of economic disadvantage for low-income people of color by lowering access to home ownership, a way of building equity which can be leveraged for further credit access and increased overall wealth (Pincus, 1996).

The disparities reinforced by systemic and structural racial discrimination concentrate disadvantage in minority neighborhoods. This concentration of disadvantage has a profound effect on the health of Black people, and the consequences extend to higher prevalence of disease and diminished life expectancy (Williams, 1999). Racism has been responsible for the implementation of specific policies in order to create a system of racial inequality. The legacy of that system results in adverse health outcomes and shorter lifespans for people of color today.

Redlining, the HOLC Maps And Segregation

What is redlining?

The origin of concentrated disadvantage is clearly traceable from slavery and economic exclusion to decisions and policies of the last century which were keystones of residential segregation in urban areas. One practice which became notorious due to its widespread impact in the imposition of residential segregation is redlining. The term redlining refers to discriminatory practices which denied access to credit and insurance for borrowers in neighborhoods that were economically disadvantaged and/or had high percentages of minorities. Redlining was widespread, even in areas of the country that were not subject to the most extreme aspects of “Jim Crow” segregation (Rothstein, 2017). Its pervasiveness in the mortgage industry can be partly explained by the Federal Housing Administration’s (FHA) sanctioning of the practice (Dymski, 2006). Underwriting guidelines of the FHA directly supported segregationist practices, stipulating that neighborhood stability and the presence of “incompatible racial and social groups” were elements that should be considered during the appraisal and assessment process for qualifying mortgage lending.[7] Federal and local governments, and the banking and real estate industries were complicit in redlining. Redlining imposed barriers to the flow of capital in many low-income neighborhoods and in Black and other minority communities, creating the circumstances for long-term racial segregation. It also favored the formation of separate real estate markets in segregated neighborhoods with different rates of appreciation and capacity for generating equity and wealth for White people versus Black and Hispanic people (Shapiro, 2004). 

It wasn’t until 1962 that President Kennedy banned housing discrimination by federally funded housing agencies.[8] Redlining in the private sector continued until the Fair Housing Act of 1968 was signed into law by President Johnson.[9] The deleterious impact of redlining on communities was recognized the following decade when the Community Reinvestment Act (CRA) of 1977 was passed by Congress.[10]CRA places an affirmative obligation for banks to provide loans and services in low- and moderate-income communities regardless of their racial makeup. Additional measures, such as passage of the Home Mortgage Disclosure Act (HMDA) in 1975, provide additional insight into the mortgage lending process, making data on mortgage applications and decisions, along with the race, ethnicity, gender and income of borrowers and the neighborhood, publically available.[11] Studies on racial disparities in lending have often relied on the HMDA dataset and qualitative work, and have indicated that despite laws like the Fair Housing Act and CRA, racial inequities in the number of approvals and interest rates of residential mortgage loans persist (Holloway, 1998; Apgar and Calder, 2005; Quillian et al., 2020). Segregation was imposed or compounded by redlining, other local and federal housing policies and discriminatory social practices. This is one cause of long-term disinvestment in lower-income minority communities and a central factor in the concentration of disadvantage and poverty in communities (Massey & Denton, 1993).  

How the HOLC maps have been interpreted

            The scope of redlining in U.S. cities is documented by the numerous maps created by the Home Owners’ Loan Corporation (HOLC) in the 1930’s. The HOLC was a federal agency established in 1933 as the Great Depression gripped the economy. The HOLC made more than one million loans to prevent foreclosures on mortgage holders in urban areas, providing relief to Americans of all backgrounds while buttressing the banking system by removing underwater mortgages from their books (Hillier, 2005; Crossney and Bartlett, 2005; Michney and Winling, 2019). It also initiated innovative programs, like longer-term loan amortization with a low interest rate that became the foundation of modern mortgages (Jackson, 1985). Despite this, the HOLC was instrumental in formalizing processes of neighborhood evaluation through their “City Survey” program which ran from 1935 through about 1940. This project was intended to provide a comprehensive assessment of mortgage lending risk, and qualify neighborhoods as more or less likely to contain properties in jeopardy of default. The City Survey program created  “residential security” maps by grading city neighborhoods using a standardized form which was very comprehensive in its evaluation of sales, location, structural integrity and quality of homes, access to transportation and amenities, and proximity to industrial and commercial nuisances. The forms also considered the socioeconomic, racial, ethnic and national make-up of neighborhoods. Neighborhoods in which minorities lived were almost always downgraded to the lowest of four classification grades – “hazardous” and shaded in red on the maps.[12] When the maps were first found in the 1980’s, they were considered to be direct evidence of federal complicity in residential segregation (Jackson, 1985). Subsequent scholarship has modified this view somewhat, uncovering a complex story behind the HOLC activities and production of the maps, and questioning how widely they were circulated. While the extent of circulation of the residential security maps is unclear, production of the maps involved local real estate and banking experts, consequently, the maps provide historical documentation of the city neighborhoods which would have been redlined, and those which would have been preferred by lenders and the FHA. The HOLC’s systematic grading of neighborhoods is the most comprehensive record of the logic used in property valuation by credit-making institutions. This logic was part of the national standardization of real estate valuation practices being led by Homer Hoyt and Fredrick Babcock at FHA. The valuation methods and procedures of the HOLC are evident in FHA maps and their underwriting manual that was used until the civil rights era brought changes to federal policy (Greer, 2012). 

Segregation, Public Health and COVID-19

Overview

The novel coronavirus (COVID-19, severe acute respiratory syndrome coronavirus 2; SARS CoV-2) pandemic has highlighted and exacerbated many racial health inequities that existed well before this public health crisis. People of color are disproportionately contracting COVID-19, and because they are more likely to have underlying health conditions, are also facing an increased risk of severe illness and mortality from COVID-19 (CDC, 2020). While COVID-19 has pushed racial health inequities into the national spotlight, the underlying differences in social, economic and environmental conditions that have given rise to inequities in COVID-19 infection, transmission and severe illness are not new (CDC, 2020).

Race- and place-based discrimination, both past and present, have created and actively maintained racial residential segregation. Racial residential segregation has systematically shaped characteristics of the built environment that may increase susceptibility to not only COVID-19, but other underlying health conditions that increase the susceptibility to and severity of illness from COVID-19. Racial residential segregation may impact health through poor housing conditions, disparity in educational and employment opportunities, inadequate transportation infrastructure, access to healthcare and economic instability (Barber et al., 2020; Bailey et al., 2017; Diez Roux and Mair, 2010). Where people live impacts their exposure to health promoting resources and opportunities (i.e., access to quality food, recreation, healthcare, etc.) as well as exposure to health damaging threats (i.e., environmental pollutants, poor housing quality, etc.) (Diez Roux and Mair, 2010). Robust literature has documented racial residential segregation as a determinant of racial health inequities (Williams & Collins, 2001; Williams, Lawrence, & Davis, 2019; Bailey et a., 2017; Kramer & Hogue, 2009; Gee & Ford, 2011; White & Borrell, 2011). Racial residential segregation has been linked to cardiovascular disease (Kershaw et al., 2015), hypertension (Kershaw et al., 2011; Barber et al., 2018), diabetes (Barber et al., 2018), obesity (Pool et al., 2018), asthma (Alexander & Currie, 2017) and many other adverse health conditions (Beyer et al., 2016; Morello-Frosch & Jesdale, 2006; Debbink & Bader, 2011; Mehra, Boyd, & Ickovics, 2017; McFarland & Smith, 2011). Structural racism and racial residential segregation are associated with stark differences in neighborhood resource distribution, concentrated disadvantage and health. These obstacles are not recent in origin, but are rooted in historical policies and practices.

Epidemiology of SARS COV-2

SARS-CoV-2 is a novel coronavirus belonging to the β-coronavirus cluster (Sun et al., 2020). The first cases of SARS-CoV-2 were documented in December 2019 in Wuhan, China (Jayaweera et al., 2020). The outbreak was declared a pandemic by the World Health Organization (WHO) on March 11, 2020. The most common symptoms of SARS-CoV-2 include fever, cough, fatigue, muscle pain and dyspnea.[13] SARS-CoV-2 is transmitted by contact with respiratory droplets either person-to-person or person-to-environment, and, in clinical and indoor settings, aerosol (airborne) transmission has been documented (Jayaweera et al., 2020). Standard epidemiologic parameter estimates, including transmission rate and case fatality rate, vary by country and study due to differing population structures, testing coverage and reporting.

In the U.S., minorities, particularly Black and Hispanic individuals, are disproportionately infected by SARS-CoV-2. National data from the Centers for Disease Control and Prevention (CDC) through May 28, 2020, detail that Black and Hispanic residents are three times more likely to be infected and two times as likely to die from COVID-19 compared to Whites.[14] These disparities have been ascribed to differential access to health care, household size and essential worker status, however, the root cause of these inequalities is structural racism.[15]

COVID-19 health risk factors

Information about COVID-19 is evolving as scientific experts learn more about this disease. At the time of this report, the latest revision from the CDC on June 25, 2020, reported that people of any age with the following underlying health conditions have an increased risk for severe illness from COVID-19: chronic kidney disease, COPD (chronic obstructive pulmonary disease), obesity, severe heart conditions, type 2 diabetes, sickle cell disease and those with a weakened immune system from solid organ transplant (CDC, 2020). Additionally, the CDC reports that people with the following conditions might have an increased risk for severe illness from COVID-19: asthma, hypertension or high blood pressure, type 1 diabetes, cerebrovascular disease, cystic fibrosis, neurologic conditions, liver disease, those who are pregnant, pulmonary fibrosis, those who smoke, thalassemia, and those with a weakened immune system from blood or bone marrow transplant, immune deficiencies, HIV and use of corticosteroids or other immune weakening medicines (CDC, 2020).

HOLC residential security maps & public health

            While measures of racial residential segregation are commonly used as a proxy for structural racism, to date, there have been few studies which empirically measure the effect of structural racism on health (Bailey et al., 2017; Krieger, 2014; Hardeman et al., 2018). However, after the recent digitization of the HOLC residential security maps, several studies have evaluated HOLC grades, as a measure of structural racism, in relation to current health outcomes and social determinants of health (Huggins, 2017; Jacoby et al. 2018; McClure et al. 2019; Namin et al., 2020; Transgenstein et al., 2020; Hoffman et al., 2020; Nardone et al., 2020; Krieger et al., 2020; Krieger et al., 2020). Hoffman, Shandas and Pendleton (2020) and Namin et al. (2020) examined cities across the country, while the remaining studies evaluated HOLC grades within single cities (Huggins, 2017; Jacoby et al. 2018; McClure et al. 2019; Transgenstein et al., 2020; Krieger et al., 2020) or cities within a state (Nardone et al., 2020). While predominantly using ecological models to evaluate neighborhood level health outcomes, a few studies have utilized multilevel models to inform individual level inferences (McClure et al., 2020; Krieger et al., 2020; Krieger et al., 2020). From examining environmental exposures (Hoffman et al., 2020; Namin et al., 2020), preterm birth (Krieger et al., 2020), cancer state at diagnosis (Krieger et al., 2020), crime (Jacoby et al. 2018), asthma outcomes (Nardone et al., 2020), alcohol outlet clusters (Transgenstein et al., 2020) and self-reported health (McClure et al. 2019), these studies have collectively raised awareness on the legacy of government-sponsored redlining practices that were initiated in the 1930s on current population health.

Racism, segregation & COVID-19

Further, amidst the COVID-19 pandemic’s disproportionate impact on the country’s Black population, Barber et al. (2020) examined racial residential segregation and COVID-19 cases in Philadelphia, guided by theoretical frameworks for studying structural racism. The HOLC’s historical practices of redlining and other discriminatory lending practices were instrumental in driving the stark segregation seen in Philadelphia today. While not explicitly measuring HOLC redlining maps, Barber et al. (2020) acknowledge how these historical processes established the physical, economic and social conditions that are giving rise to racial inequities in COVID-19. They illustrate how structural racism embedded in our interlocking social, legal, economic and political systems interact to drive disproportionate prevalence of COVID-19 infection, transmission and mortality in Black communities (Barber et al., 2020). Their results showed that the most segregated neighborhoods in Philadelphia were more likely to have structural susceptibility to COVID-19 (a measure encompassing neighborhood indicators that increase the likelihood of exposure and community transmission, limit ability to access testing and treatment, and capture economic hardship). Further, the COVID-19 case rate in the five most segregated neighborhoods was twice that of the COVID-19 case rate in the five least segregated neighborhoods. These findings suggest that segregation acts as a structural driver of racial inequities in Philadelphia and calls for both short- and long-term solutions that center structural racism and health equity in the COVID-19 response.

Public health indicators

Life expectancy at birth is a common indicator of population health and social development, representing the average number of years a newborn is expected to live under current age-specific mortality rates (WHO, 2014). Life expectancy accounts for mortality risks and trends, thus is used to track improvements in health (WHO, 2014). While overall life expectancy has steadily risen since 1900 in the United States, racial inequalities in life expectancy, particularly between Blacks and Whites, have persisted (Kochanek, Arias and Anderson, 2015; Harper et al., 2007). Studies at both an individual and neighborhood level have found that exposure to racial residential segregation was associated with shorter life expectancy among Blacks (LaVesit, 2003; Collins and Williams, 1999). Additionally, among the 500 largest cities in the United States, the difference in life expectancy ranged between 20 and 30 years depending on which neighborhood an individual lived in; this gap was largest in cities with stark racial residential segregation (NYU NewHub, 2019).

Mental health is increasingly monitored as an indicator of population health and chronic disease burden (CDC, 2009). Poor mental health can adversely impact social engagement, functioning, health behaviors and physical health (CDC, 2015). People of color bear a disproportionate burden of unmet mental health needs (Office of Surgeon General, 2001) and racial residential segregation differentially shapes access to mental health services (Dinwiddie et al., 2013).

Gaps in our hypothesis

Previous work by NCRC identified HOLC “Hazardous” graded neighborhoods as economically disadvantaged, with much higher proportions of low- and moderate-income (LMI) families (74%) and people of color (64%) than the higher graded “Best” neighborhoods. The present study explored the legacy of HOLC residential security maps, as a measure of structural racism, on current health indicators that are considered risk factors for COVID-19 infection and severe illness, making it one of the first inquiries into historical redlining in cities across the nation on numerous present-day neighborhood health outcomes.

How might redlining from 80 years ago influence current health? A recent paper by Krieger et al. (2020) outlines specific pathways which provide a theoretical linkage for the association of redlining and segregation, neighborhood disinvestment and health. This pathway model is modified in Figure 1 to show the historical development and linkages between residential segregation and health outcomes. Public policies, instituted beginning in the 1890’s and 1900’s and extending through passage of the Fair Housing Act in 1968, provided the institutional and legal structure of segregation. These included local codification of segregation in residential areas, racially restrictive covenants and deeds and, in some cases, regulations on land-use (Rothstein, 2017). Governmental policies and social structures of the time buttressed residential segregation, with mortgage and insurance redlining establishing neighborhood trajectories of investment and disinvestment. During the post-war period, major changes to the U.S. urban system were underway with suburbanization, construction of the national highway system and “block-busting” and “White-flight” from central cities (Jackson, 1985). This migration and reconfiguration of urban and suburban areas shaped patterns of consumption and impacted availability for a wide range of neighborhood services from food availability to financial services, healthcare (Cohen, 2003) and exposure to disamenities and environmental hazards (Pulido, 2000). The differential availability of educational and employment opportunity, services and exposure to hazards impacts the physical and mental wellbeing of people living in segregated neighborhoods (Dreier et al, 2004).    

Hypothesized pathways
Figure 1. Hypothesized pathways linking redlining and policies of segregation to current health outcomes at the neighborhood level. (After Krieger, 2020)

This study expanded on prior work in order to examine the association of the HOLC residential security grades with adverse neighborhood health and other forms of disadvantage. The HOLC low-graded areas of cities are historically disadvantaged neighborhoods where the combination of segregation and disinvestment created the circumstances of concentrated disadvantage for residents, which may operate through numerous mechanisms identified by Krieger et al. to influence current population health. This study assessed statistical associations of the HOLC grading and a range of current indicators of COVID-19 vulnerability.

Methods

Design

This ecological study was structured to examine the spatial coincidence of HOLC neighborhood grading and the prevalence of adverse health outcomes and public health outcomes. Two modes of analysis are undertaken: Analysis of Variance (ANOVA) to assess statistical significance of differences in neighborhoods scored by the extent of redlining, and regression equations for effect estimation. The neighborhood HOLC grade was assessed through a “historical redlining score.” The historical redlining score was calculated and divided into quartiles nationally. Regression models utilized health outcome data and data on social and demographic factors as the dependent variable, with the continuous historical redlining score as the primary predictor variable. Additional covariates, including the percent minority population and median age, were used to control for potential confounding of the relationship between the historical disinvestment score and the health and social disadvantage variables.

Study area and data

Data from the residential security maps created by the HOLC’s City Survey program is hosted by the University of Richmond Digital Scholarship Lab as part of their “Mapping Inequality: Redlining in New Deal America” project.[16] The data includes scans of the original residential security maps, along with examiner grading sheets and digitized shapefiles of the neighborhoods. The shapefiles are georectified and suitable for projection and use in geographic information systems (GIS). This archive is an extensive and expanding repository of the maps for cities throughout the United States, and served as our primary source material. census tract level data from the 2019 release of the CDC’s “500 Cities: Local data for better health,” which included small-area estimates from 2016 and 2017, was used as a primary source for most of the health-outcome related variables.[17] Other data utilized included the CDC’s “small-area life expectancy estimates project” for 2010-2015 and U.S. Census American Community Survey five-year (ACS 5-year) data estimates for 2013-2017.[18] [19] [20]

Variables:

Historical redlining score

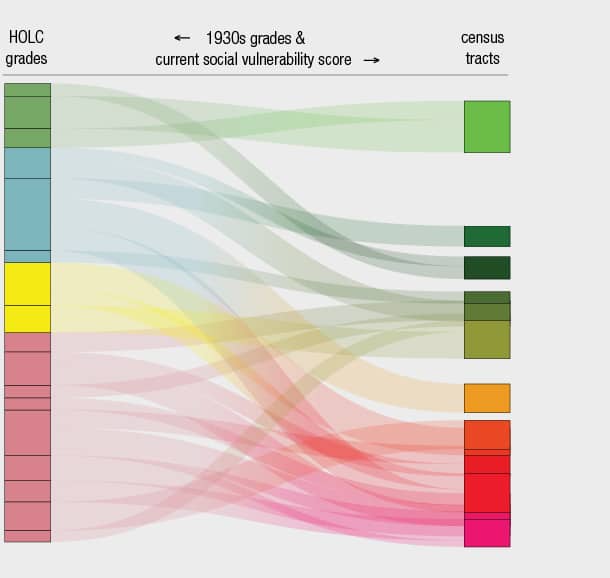
Neighborhoods in the original HOLC maps were based on boundaries established by the HOLC examiners themselves. These do not align with U.S. census tract boundaries, which are adjusted decadallyand can fluctuate considerably as population shifts over time. This spatial mismatch proves a challenge when attempting to analyze present conditions in the HOLC designated areas. To solve this problem, a weighting method was developed in order to establish a historical redlining score as a continuous variable (Figure 2).[21] First, we established the total area of land within each census tract that was graded by the HOLC. Census tracts, in which less than 20% of the land area was graded, were discarded from the analysis as being insufficiently impacted. A total of 12,834 census tracts were classified representing 142 core-based statistical areas (CBSAs) across the country. Next, the total percent of the area within each census tract graded “A=Best,” “B=Still Desirable,” “C=Definitely Declining” and “D=Hazardous” were defined and this percent was multiplied by number values — 1-4 representing each HOLC grade. For example, if 50% of the census tract’s graded area was classified “A” and 50% was “B,” the calculation would be ((1 * 0.50) + (0.50 * 2)) = 1.50. Lower historical redlining scores indicate higher grades, while higher scores up to 4.0 represent a greater portion of the area being scored hazardous and consequently having been redlined.   

Method of calculating the neighborhood
Figure 2 – Method of calculating the neighborhood-level historic redlining score.

For the national-level analysis, the historic redlining scores were ranked and sorted into quartiles for comparison purposes. The first quartile represents areas with the least redlining and the fourth represents the highest scores indicative of greater redlining (Table 1). The HOLC maps categorized many more neighborhoods with a low, or “hazardous” grade, than with the highest, or “best” grade. Consequently, the mean of the fourth quartile is 3.94, with a “D” grade being 4.00, while the mean of the first quartile of 1.87 is closer to the numeric value of a “B” grade at 2.00.

Break points for quarterlies
Table 1 – Break points for quartiles of the historical redlining score for census tracts with at least 20% of their area HOLC graded and ranked nationally.

Variables relating to demography, socioeconomic status, social vulnerability and specific health outcomes at the census tract level were used in this analysis. Population counts were taken from the U.S. Decennial Census data for 2010. The most recent Census American Community Survey (ACS) 2014-2018 provided five-year estimates for tract level data on the percent of minority residents, median age and percent of the population aged 65 and over. These estimates provided an indication of the prevalence of more vulnerable minority and older populations. The ACS 2014-2018 data also contained variables for the percent of the population that was insured and levels of poverty, indicative of the financial means to access health care and economic vulnerability. For the population health indicators, data from the 2019 CDC “500 Cities” dataset was used, which covered data collected in 2016 and 2017, and aligned well with the census demographic data. Using the CDC 500 Cities dataset, we focused on the prevalence of the following risk factors of increased severity of COVID-19 illness among adults 18 years of age or older:[22] diabetes, hypertension, high cholesterol,[23] chronic kidney disease, COPD, stroke, obesity and asthma.[24] Data on life expectancy at birth obtained from the U.S. Small-area Live Expectancy Estimates Project (USALEEP) was utilized as an indicator of general population health.[25] The CDC also calculates an index of social vulnerability (SVI) to evaluate the resilience of neighborhoods to a wide range of hazards including human and natural disasters and outbreak of diseases, such as COVID-19.[26] Social vulnerability indices are widely utilized in the hazards and public health fields, providing a general indication of community susceptibility or resiliency to a wide range of natural and human-caused disasters. Social vulnerability indices are constructed from a composite of different variables taken from census data that are related to increased community vulnerability.[27]   

Statistical analyses

Means and standard deviations for current sociodemographic and COVID-19 health risk factors of census tracts were calculated nationally for all census tracts and then by historic redlining score quartile. Descriptive differences in patterns of disadvantage and COVID-19 health risk factors were formally tested with a One-Way Analysis of Variance (ANOVA), a procedure which estimates the variation between groups of the same variable (Field, 2013). Several conditions for the data in the dataset need to be met for the statistical models classified as ANOVAs to be valid. The data should have equivalent sample sizes, be normally distributed, randomized, with homogeneity of the variance of the residuals. When tests for these assumptions were run, the variables in the datasets had violations of the tests for homogeneity of the variances. Additionally, the sample sizes for each quartile ranged from 1,671 to 3,411, violating the precondition for equivalence. Consequently, more robust tests such as Welch’s test for the equality of the means needed to be employed to successfully assess the overall differences between the groups. Welch’s test indicates whether the overall trend in the difference of means for the first, second, third and fourth quartiles are statistically significant. A Games-Howell post-hoc test was then conducted to evaluate a pairwise comparison of the means for each quartile. The Games-Howell test can be used when sample sizes are different and provides more rigorous confidence intervals than other post-hoc tests. Finally, a series of linear regression models were generated to estimate the association between historic redlining score and COVID-19 health risk factors adjusting for several factors. The first model is unadjusted, the second model adjusts for median age and state where the census tract is located and the third model additionally adjusts for percent of the population within a tract classified as non-White.

Results

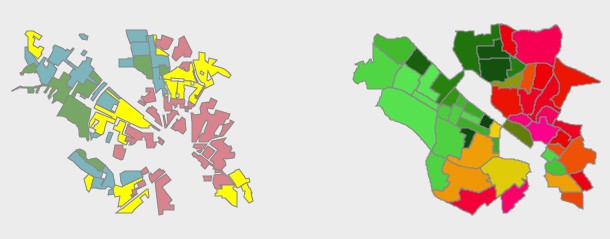
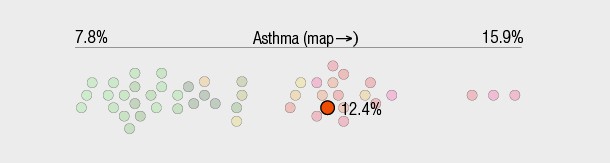
A total of 12,833 census tracts were assigned a historic redlining score. Tract-level sociodemographic characteristics, including the percent minority population, median age and percent poverty were available for 12,833 tracts. For percent age 65 years and older, data was available for 12,829 tracts. Data on estimated life expectancy at birth was available for 11,890 tracts, and for social vulnerability as measured by the CDC’s SVI, 12,830 tracts. Figure 3 provides a map overlay example focused on St. Louis demonstrating the original 1937 HOLC grading, the historic redlining scores with life expectancy and social vulnerability by CBSA quartiles.[28] For all COVID-19 health risk factors, data were available for 10,248 tracts. Table 2 shows the distribution of sociodemographic characteristics and COVID-19 health risk factor prevalence at the national level and by quartile of historic redlining score. On average, census tracts included in this analysis were approximately 46.6% minority populations, had 21.7% living in poverty and a median age of 36.3 years with 13.1% 65 years or older. The mean tract-level prevalence of COVID-19 risk factors were as follows: 31.9% for hypertension, 32.0% for obesity, 11.9% for diabetes and 10.3% for asthma. Average prevalence for COPD was 6.8%, 3.3% for kidney disease and 3.6% for stroke. In addition, the average tract level prevalence for percent of the population with mental health issues was 14.8%.

St. Louis, MO
Figure 3 – Maps of the original HOLC grading, divisions of census tracts into quartiles by the historic redlining score, life expectancy at birth and social vulnerability by quartiles. (Source: Mapping Inequality Project, Univ. of Richmond; author’s calculation of historic redlining score; CDC life expectancy 2010-2015, and CDC SVI 2018)

The distribution of sociodemographic characteristics and COVID-19 health risk factors were then examined by quartile of historic redlining score (Table 2). Quartile 1 included tracts with the lowest levels of historic redlining while Quartile 4 included tracts with the highest levels of historic redlining. A pattern of current disadvantage and higher prevalence of COVID-19 health risks was observed with greater levels of historic redlining. For example, the average poverty percentage increased from 14.3% in tracts in the lowest quartile of historic redlining score to 28.1% in tracts in the highest quartile of historic redlining score. A similar trend was observed with the social vulnerability index. Tracts with higher historic redlining scores had higher average proportions of minority residents (57.0%) than tracts with lower historic redlining scores (34.6%). While the average life expectancy fell from 79.4 years in the lowest quartile to 75.8 years in the highest, differences in the average median age (38.8 years versus 34.4 years) and the average percent of the population aged 65 and older (14.4% versus 11.7%) were higher in the lowest quartile, suggesting that life expectancy declines were not driven by population age distributions.

COVID-19 health risk factors were also patterned by levels of historic redlining score, with higher average prevalence of asthma, COPD, diabetes, hypertension, kidney disease and stroke observed in tracts with greater historic redlining scores. This is despite quartile 1 tracts (i.e., low historic redlining) having higher average median age and higher percentages of people age 65 years and older. The average prevalence of poor mental health also increased from 12.7% to 16.1% in low historic redlining areas compared to high historic redlining areas.

Descriptives at the CBSA level
Table 2 – Descriptives at the CBSA level, then ranked by quartile.

Results of the One-Way ANOVA Games-Howell post-hoc test for difference in the means of the first and fourth quartiles are presented in Table 3. The table shows the difference of the means for each variable contrasting the highest (fourth) and lowest (first) quartiles of historic redlining score. The mean values for percent minority, percent poverty and SVI were all statistically significantly higher in tracts with the highest historic redlining score compared to tracts with the lowest historic redlining score. As expected, average median age, percent of population age 65 years and older and life expectancy are all statistically significantly lower in tracts with the highest historic redlining score. Full results of mean contrasts between all quartiles by sociodemographic characteristics and COVID-19 health risk factors are available in the Appendix.

Health indicators with historic disinvestment score divided by quartile nationally.
*Games-Howell post-hoc test of the significance of the differences of the means.
Table 3 –  Results of ANOVA with Games-Howell post-hoc test for significance of the differences – Health indicators with historic disinvestment score divided by quartile nationally. Quartiles 4 and 1 differences only.


Table 4 shows the results from a series of linear models that assessed the association between historic redlining score and average prevalence of COVID-19 health risk factors and sociodemographic variables. A higher historic redlining score was statistically significantly associated with increased prevalence for all COVID-19 health risk factors considered. For example, a one unit increase in historic redlining score was associated with a 1.64% increase (95% CI: 1.52, 1.76) in tract average prevalence of diabetes. All associations between the historic redlining score and COVID-19 health risk factors were robust to adjustment for median tract age and state. However, they were attenuated by additional adjustment for percent non-White residents in the tract, as is to be expected when controlling for a mediating variable. The adjusted R-squared for each model was also reported and the proportion of variance explained were consistent with ecological analyses of distal exposures.

Results of OLS regression models utilizing health impacts
Table 4 – Results of OLS regression models utilizing health impacts as the dependent variable and historic disinvestment score as the predictor variable, followed by adjusted models with median age, state and percent minority added as additional predictors.

Discussion

The goal of this study was to determine if historic redlining, as measured by HOLC residential security maps, was associated with a range of current indicators of COVID-19 vulnerability in 142 urban centers across the United States. Our results show that greater historic redlining was associated with historic redlining score was associated with higher current levels of socioeconomic disadvantage, increased social vulnerability and adverse health outcomes that are risk factors for COVID-19, illustrating the lasting impact of government supported practices of redlining on neighborhood health and characteristics 80 years after their deployment. These findings are consistent with other recent studies. Racial inequities in COVID-19 infection and severity of illness have been observed (CDC, 2020; Kullar et al, 2020; Oppel et al., 2020). Additionally, the COVID-19 pandemic has highlighted and exacerbated existing racial inequities in chronic disease burden, access to healthcare and other social conditions that drive poor health outcomes (Artiga, 2020; Abrams & Szefler, 2020; CDC, 2020). The patterned distribution of risk factors, both socioeconomic and health, for COVID-19 infection and prognosis presented by our study provides evidence that current health disparities are a symptom of deep societal inequities generated by racist policies, such as historic redlining, resulting from structural racism.

Structural racism represents “the totality of ways in which societies foster racial discrimination through reinforcing systems of housing, education, employment, earnings, benefits, credit, media, health care, and criminal justice” which in turn, reinforce racism in values, belief systems and resource distribution (Bailey et al., 2017; Reskin, 2012). Our results are in line with a growing literature that has documented structural racism as an upstream driver of racial health inequities (Bailey et al., 2017; Hardeman et al., 2018; Williams et al., 2019; Pabayo et al., 2019; Lukachko et al., 2014; Wallace et al., 2017; Wallace et al., 2016; Krieger et al., 2013; Krieger et al., 2014; Chambers et al., 2019). Additionally, recent studies have specifically documented historical government sponsored redlining policies as a structural determinant of individual and neighborhood level health (Huggins, 2017; Jacoby et al. 2018; McClure et al. 2019; Namin et al., 2020; Transgenstein et al., 2020; Hoffman et al., 2020; Nardone et al., 2020; Krieger et al., 2020; Krieger et al., 2020). Our study adds to this literature by documenting structural racism, represented by HOLC residential security risk, as an upstream determinant of numerous neighborhood health outcomes in cities across the nation.

Racial residential segregation is a product of the numerous ways that structural racism, past and present, is embedded in American society through reinforcing social, legal and political systems (Garcia & Sharif, 2015; Hahn, 2017). Krieger et al. (Figure 1) illustrated potential pathways by which historic redlining practices have driven neighborhood disinvestment, segregation and poor health. Racist housing policies and practices not only created and maintained racial residential segregation, they also established trajectories of investment and disinvestment that continued to be reinforced for decades (Krieger et al., 2020). Suburbanization, the national highway system, “block-busting,” exclusionary zoning and other racialized steering practices shaped the housing market and the development of cities across the country, both reinforcing racial residential segregation and imposing its barriers in places where it previously did not exist (Rothstein, 2017). Racialized disinvestment in neighborhoods of color historically hindered development which is actively maintained today through race- and place-based discrimination, driving the stark racial segregation seen across the country.

Racial residential segregation is a foundation of structural racism and contributes to racialized health inequities (Bailey et al., 2017). Structural racism and racial residential segregation are both considered fundamental causes of racial health inequities because of the numerous ways they operate to shape health (Williams & Collins, 2001; Williams, Lawrence & Davis, 2019; Phelan & Link, 2015). Segregation can impact health through the built environment, concentrated economic hardship, access to opportunities and disproportionate burden of environmental hazards (Kramer & Hogue, 2009; Williams & Collins, 2001; White & Borrell, 2011). Racial residential segregation systemically shapes the distribution of resources, which in turn, reinforces unequal social, economic and environmental conditions that give rise to poor health (Bravemen & Gottlieb, 2014; Communities in Action, 2017). A neighborhood’s built environment impacts access to quality food, transportation, educational and employment opportunities, recreation and preventative health services (Hahn, 2017; Williams et al., 2019). Concentrated poverty and the co-occurence of other social conditions linked to poverty and segregation can hinder health promoting behaviors (Williams et al., 2019). Low-income neighborhoods of color are less likely to have access to full-service grocery stores and more likely to have a high density of tobacco and alcohol outlets (Williams et al., 2019; Berke et al., 2010; Powell et al., 2007; Lee et al., 2017). Additionally, racial residential segregation can shape differences in housing quality, exposure to environmental hazards and healthcare access, utilization and quality (Landrine and Corral, 2009; Bailey et al., 2017). Racial residential segregation is a manifestation of decades of structural racism and disinvestment that profoundly shapes neighborhood disadvantage and health through a myriad of intermediate pathways. Low-income communities of color have been subject to decades of racist housing policies and disinvestment that contribute to concentrated disadvantage and poor health.

As our results showed, neighborhoods with high historic redlining were associated with higher levels of social vulnerability, lower socioeconomic status and higher prevalence of risk factors of COVID-19 morbidity, documenting spatially concentrated disadvantage in cities across the country. The intersection of structural racism and racial residential segregation provides insight on the unequal distribution of the economic and health burdens of COVID-19. Further, acknowledging and measuring the historical processes that have lasting impacts on neighborhood contexts today provide a more holistic understanding of how structural racism operates to drive racial inequalities in health.

This study has limitations. The HOLC residential security maps are only one form of institutional racism in the housing market. HOLC residential security maps were created in more than 200 U.S. cities (Hiller, 2005), however, racial residential segregation has been imposed across the U.S. over decades through evolving policies and practices, the totality of which is not represented in the HOLC maps. The ecological design of the study limits inferences to a neighborhood level, which prevents the ability to assess individual-level racial inequities in health outcomes. However, the neighborhood-level associations documented in this study can be utilized to inform policy recommendations and future studies at an individual level.

Acknowledging these limitations, the study documents the legacy of structural racism on current neighborhood socioeconomic indicators and health in 142 urban centers across the country. Strengths of the study include the methodology, scope and relevance. Our method for calculating historical redlining scores captures a continuous representation of the degree to which a neighborhood was subject to HOLC redlining practices. This is one of the first studies to evaluate the legacy of HOLC redlining maps on health at a national scale (Namin et al., 2020; Hoffman et al., 2020). Additionally, in connecting historic redlining to risk factors of severe COVID-19 illness, we provide relevant context for policy changes amidst the COVID-19 public health crisis.

While racial residential segregation was historically imposed through federal agencies like the HOLC decades ago, urban hypersegregation continues to this day (Massey & Tannen, 2015). Following HOLC, structural racism continued to permeate the housing market through discriminatory lending practices, exclusionary zoning and many other practices that reinforce racial inequality and segregation (Rothstein, 2017; Taylor, 2018). Equity-focused reforms are necessary to combat the ways in which structural racism persists in the operations of the housing market. Housing and economic policies must address the ways structural racism, both past and present, has disproportionately burdened neighborhoods of color for decades.

Conclusion and Policy Recommendations

This study extended upon other work that found a close relationship between government-sanctioned and promoted racial, cultural and class-based residential segregation with public health outcomes in neighborhoods today. In the 142 urban areas for which HOLC redlining maps are available, the neighborhoods considered hazardous or declining almost a century ago have higher prevalence of poor health indicators than areas without these designations. These inequities in health, stemming from racist housing policies, have created pockets of the population vulnerable to public health crises, such as the COVID-19 pandemic.

These disparities are not limited to the HOLC graded cities. There is evidence that even in parts of urban areas unmapped by the HOLC, or in cities where no HOLC map was created, that the policies and techniques of the HOLC were adopted by the FHA and private institutions.[29] We now are left to contend with stunning gaps in health, wealth and prosperity between neighborhoods not intentionally starved of investment and neighborhoods that were consigned as parts of these cities without safe housing, sanitary water or functioning public services. There are several overarching policies that NCRC supports and which have the potential to remediate some of these transgressions. Local communities will need to engage and be allowed to tailor these policies to fit their unique situation, but we must start with the understanding that segregation, a product of structural racism, and all of the negative impact that it imparts, is a choice we make daily. We can choose to be better. Some policies that NCRC supports include:

  • Restore the Affirmatively Further Fair Housing (AFFH) rule that President Trump and Secretary of Housing Ben Carson have cancelled. This rule encouraged communities to identify and reduce concentrated areas of poverty.
  • Support inclusionary zoning that adds affordable housing choices outside of the redlined sections of the city and promotes the reduction of concentrated areas of poverty.
  • Expand the Community Reinvestment Act (CRA) to include non-banks and to modernize how this law is implemented.
  • Encourage locally relevant solutions such as expanded Section 8 and rent control/vouchers. Protect public housing.
  • Modernize and expand access to data and other information for local communities on lending and investment in their area.
  • Explore how reparations, housing and desegregation intertwine. Talk with residents about how best to preserve culture and community while moving towards a solution where one’s health is not detrimentally affected by the place where they were born.

Citations

Cutter, S. L., Boruff, B. J., & Shirley, W. L. (2003). Social vulnerability to environmental hazards. Social science quarterly, 84(2), 242-261.

Dreier, P., Mollenkopf, J. H., & Swanstrom, T. (2001). Place matters: Metropolitics for the twenty-first century.  Lawrence: University Press of Kansas.

Massey, D. S., & Denton, N. A. (1993). American apartheid: Segregation and the making of the underclass. Harvard University Press.

Farley, R. (1993). Neighborhood preferences and aspirations among Blacks and Whites. Housing Markets and Residential Mobility, 161-191.

Farley, R., Fielding, E. L., & Krysan, M. (1997). The residential preferences of Blacks and Whites: A four‐metropolis analysis. Housing Policy Debate, 8(4), 763-800.

Charles, C. Z. (2003). The dynamics of racial residential segregation. Annual review of sociology, 29(1), 167-207.

Krysan, M., & Farley, R. (2002). The residential preferences of Blacks: Do they explain persistent segregation?. Social Forces, 80(3), 937-980.

Galster, G. C. (1986). More than skin deep: The effect of housing discrimination on the extent and pattern of racial residential segregation in the United States. Housing desegregation and federal policy, 119-138.

Yinger, J. (1995). Closed doors, opportunities lost: The continuing costs of housing discrimination. Russell Sage Foundation.

Muth, R. F. (1969). Cities and housing: The spatial pattern of urban residential land use, Univ. of Chicago Press, Chicago.

Clark, W. A. (1986). Residential segregation in American cities: A review and interpretation. Population research and Policy review, 5(2), 95-127.

Quillian, L. (2002). Why is black–white residential segregation so persistent?: Evidence on three theories from migration data. Social science research, 31(2), 197-229.

Kendi, I. X. (2017). Stamped from the beginning: The definitive history of racist ideas in America. Random House.

Reskin, B. (2012). The race discrimination system. Annual Review of Sociology, 38, 17-35.

Pincus, F. L. (1996). Discrimination comes in many forms: Individual, institutional, and structural. American Behavioral Scientist, 40(2), 186-194.

Pager, D., & Shepherd, H. (2008). The sociology of discrimination: Racial discrimination in employment, housing, credit, and consumer markets. Annu. Rev. Sociol, 34, 181-209.

Williams, D. R. (1999). Race, socioeconomic status, and health the added effects of racism and discrimination.

Rothstein, R. (2017). The color of law: A forgotten history of how our government segregated America. Liveright Publishing.

Dymski, G. A. (2006). Discrimination in the credit and housing markets: findings and challenges. Handbook on the Economics of Discrimination, 215, 220.

Shapiro, T., (2004) The Hidden Cost of Being African American, Oxford University Press.

Holloway, S. R. (1998). Exploring the neighborhood contingency of race discrimination in mortgage lending in Columbus, Ohio. Annals of the Association of American Geographers, 88(2), 252-276.

Apgar, W. C., & Calder, A. (2005). The dual mortgage market: The persistence of discrimination in mortgage lending.The Geography of Opportunity: Race and Housing Choice in Metropolitan America edited by Xavier de Souza Briggs (Brookings Institution Press 2005).

Quillian, L., Lee, J. J., & Honoré, B. (2020). Racial Discrimination in the US Housing and Mortgage Lending Markets: A Quantitative Review of Trends, 1976–2016. Race and Social Problems, 12(1), 13-28.

Hillier, A. E. (2005). Residential security maps and neighborhood appraisals: The Home Owners’ Loan Corporation and the case of Philadelphia. Social Science History, 207-233.

Crossney, K. B., & Bartelt, D. W. (2005). The legacy of the Home Owners’ Loan Corporation. Housing Policy Debate, 16(3-4), 547-574.

Michney, T. M., & Winling, L. (2020). New perspectives on new deal housing policy: explicating and mapping HOLC loans to African Americans. Journal of Urban History, 46(1), 150-180.

Jackson, K. T. (1985). Crabgrass frontier: The suburbanization of the United States. Oxford University Press.

Greer, J. (2012). The Home Owners’ Loan Corporation and the development of the residential security maps. Journal of Urban History, 39(2), 275-296.

Bailey, Z. D., Krieger, N., Agénor, M., Graves, J., Linos, N., & Bassett, M. T. (2017). Structural racism and health inequities in the USA: evidence and interventions. The Lancet, 389(10077), 1453-1463.

Krieger, N. Discrimination and health inequities. (2014). Int J Health Serv, 44(4), 643-710.

Cohen, L. (2003). A Consumers’ Republic: The politics of mass consumption in postwar America. Vintage Books: New York

Pulido, L. (2000). Rethinking environmental racism: White privilege and urban development in Southern California. Annals of the Association of American Geographers, 90(1), 12-40.

Dreier, P., Mollenkopf, J. H., & Swanstrom, T. (2001). Place matters: Metropolitics for the twenty-first century (pp. 107-10). Lawrence: University Press of Kansas.

Huggins, J. C. (2017). A cartographic perspective on the correlation between redlining and public health in Austin, Texas–1951. Cityscape, 19(2), 267-280.

Nardone, A., Casey, J. A., Morello-Frosch, R., Mujahid, M., Balmes, J. R., & Thakur, N. (2020). Associations between historical residential redlining and current age-adjusted rates of emergency department visits due to asthma across eight cities in California: an ecological study. The Lancet Planetary Health, 4(1), e24-e31.

Krieger, N., Van Wye, G., Huynh, M., Waterman, P. D., Maduro, G., Li, W., … & Bassett, M. T. (2020). Structural Racism, Historical Redlining, and Risk of Preterm Birth in New York City, 2013–2017. American Journal of Public Health, (0), e1-e8.

Barber S., Headen, I., Branch, B., and Yadeta, K., (2020) COVID-19 in context: Racism, Segregation and racial inequities in Philadelphia: Drexel University Urban Health Collaborative.

Field, A. (2013). Discovering statistics using IBM SPSS statistics. Sage.

Cohen, J. (1968). Multiple regression as a general data-analytic system. Psychological bulletin, 70(6p1), 426.

Diez Roux AV, Mair C. Neighborhoods and health. Ann N Y Acad Sci. 2010;1186:125-145.

Taylor KY. How real estate segregated America. Dissent. 2018;65(4):23-32.

Trangenstein PJ, Gray C, Rossheim ME, Sadler R, Jernigan DH. Alcohol Outlet Clusters and Population Disparities. J Urban Health. 2020;97(1):123-136.

McClure E, Feinstein L, Cordoba E, et al. The legacy of redlining in the effect of foreclosures on Detroit residents’ self-rated health. Health Place. 2019;55:9-19.

LaVeist TA. Racial segregation and longevity among African Americans: An individual-level analysis. Health Serv Res. 2003;38(6):1719-1734.

Collins CA, Williams DA. Segregation and mortality: The deadly effects of racism? Sociol Forum. 1999;14(3):495-523.

Hahn R. Racial and ethnic residential segregation as a root social determinant of public health and health inequity: A persistent public health challenge in the United States. Poverty & Race. 2017;26(2):3-4,10-15.

Jee-Lyn Garcia J, Sharif MZ. Black Lives Matter: A Commentary on Racism and Public Health. Am J Public Health. 2015;105(8):e27-30.

Hoffman JS, Shandas V, Pendleton N. The effects of historical housing policies on resident exposure to intra-urban heat: A study of 108 US urban areas. Climate. 2020;8(12).

Namin S, Xu W, Zhou Y, Beyer K. The legacy of the Home Owners’ Loan Corporation and the political ecology of urban trees and air pollution in the United States. Soc Sci Med. 2020;246.

Massey, D. S., & Tannen, J. (2015). A research note on trends in Black hypersegregation. Demography, 52(3), 1025-1034.

Jacoby SF, Dong B, Beard JH, Wiebe DJ, Morrison CN. The enduring impact of historical and structural racism on urban violence in Philadelphia. Soc Sci Med. 2018;199:87-95

Braveman P, Gottlieb L. The social determinants of health: it’s time to consider the causes of the causes. Public Health Rep. 2014;129 Suppl 2:19-31.

Alexander, D., & Currie, J. (2017). Is it who you are or where you live? Residential segregation and racial gaps in childhood asthma. Journal of Health Economics, 55, 186-200.

White, K., & Borrell, L. (2011). Racial/ethnic residential segregation: Framing the context of health risk and health disparities. Health and Place, 17(2), 438-448.

Office of the Surgeon General (US); Center for Mental Health Services (US); National Institute of Mental Health (US). Mental Health: Culture, Race, and Ethnicity: A Supplement to Mental Health: A Report of the Surgeon General. Rockville (MD): Substance Abuse and Mental Health Services Administration (US); 2001 Aug. Chapter 1. Introduction. Available from: https://www.ncbi.nlm.nih.gov/books/NBK44246/

Berke, Ethan M., Tanski, Susanne E., Demidenko, Eugene, Alford-Teaster, Jennifer, Shi, Xun, & Sargent, James D. (2010). Alcohol retail density and demographic predictors of health disparities: A geographic analysis. The American Journal of Public Health, 100(10), 1967-1971.

Powell, L., Slater, S., Mirtcheva, D., Bao, Y., & Chaloupka, F. (2007). Food store availability and neighborhood characteristics in the United States. Preventive Medicine, 44(3), 189-195.

Lee, J., Sun, D., Schleicher, N., Ribisl, K., Luke, D., & Henriksen, L. (2017). Inequalities in tobacco outlet density by race, ethnicity and socioeconomic status, 2012, USA: Results from the ASPiRE Study. Journal of Epidemiology and Community Health, 71(5), 487-492.

Beyer KM, Zhou Y, Matthews K, Bemanian A, Laud PW, Nattinger AB. New spatially continuous indices of redlining and racial bias in mortgage lending: links to survival after breast cancer diagnosis and implications for health disparities research. Health Place. 2016;40:34-43.

Morello-Frosch R, Jesdale BM. Separate and unequal: residential segregation and estimated cancer risks associated with ambient air toxics in U.S. metropolitan areas. Environ Health Perspect. 2006;114(3):386-393.

Debbink MP, Bader MD. Racial residential segregation and low birth weight in Michigan’s metropolitan areas. Am J Public Health. 2011;101(9):1714-1720.

Mehra R, Boyd LM, Ickovics JR. Racial residential segregation and adverse birth outcomes: A systematic review and meta-analysis. Soc Sci Med. 2017;191:237-250.

McFarland M, Smith CA. Segregation, race, and infant well-being. Popul Res Policy Rev. 2011;30:467–493.

Sun, P., Lu, X., Xu, C., Sun, W., & Pan, B. (2020). Understanding of COVID‐19 based on current evidence. Journal of medical virology, 92(6), 548-551.

Jayaweera, M., Perera, H., Gunawardana, B., & Manatunge, J. (2020). Transmission of COVID-19 virus by droplets and aerosols: A critical review on the unresolved dichotomy. Environmental Research, 109819.

Cascella, M., Rajnik, M., Cuomo, A., Dulebohn, S. C., & Di Napoli, R. (2020). Features, evaluation and treatment coronavirus (COVID-19). In Statpearls [internet]. StatPearls Publishing.

Li, Q., Guan, X., Wu, P., Wang, X., Zhou, L., Tong, Y., … & Xing, X. (2020). Early transmission dynamics in Wuhan, China, of novel coronavirus–infected pneumonia. New England Journal of Medicine.

Lipsitch, M., Swerdlow, D. L., & Finelli, L. (2020). Defining the epidemiology of Covid-19—studies needed. New England journal of medicine, 382(13), 1194-1196.

Williams DR, Lawrence JA, Davis BA. Racism and Health: Evidence and Needed Research. Annu Rev Public Health. 2019;40:105-125.

Phelan JC, Link BG. Is racism a fundamental cause of inequalities in health? Annual Review of Sociology. 2015;41:311–330.

Krieger N, Wright E, Chen JT, Waterman PD, Huntley ER, Arcaya M. Cancer stage at diagnosis, historic redlining, and current neighborhood characteristics: Breast, cervical, and colorectal cancer, Massachusetts, 2001-2015. American Journal of Epidemiology. 2020.

Hardeman RR, Murphy KA, Karbeah J, Kozhimannil KB. Naming Institutionalized Racism in the Public Health Literature: A Systematic Literature Review. Public Health Rep. 2018;133(3):240-249.

Pabayo R, Ehntholt A, Davis K, Liu SY, Muennig P, Cook DM. Structural Racism and Odds for Infant Mortality Among Infants Born in the United States 2010. J Racial Ethn Health Disparities. 2019;6(6):1095-1106.

Lukachko A, Hatzenbuehler ML, Keyes KM. Structural racism and myocardial infarction in the United States. Soc Sci Med. 2014;103:42-50.

Krieger N, Chen JT, Coull BA, Beckfield J, Kiang MV, Waterman PD. Jim Crow and premature mortality among the US Black and White population, 1960-2009: an age-period-cohort analysis. Epidemiology. 2014;25(4):494-504.

Krieger N, Chen JT, Coull B, Waterman PD, Beckfield J. The unique impact of abolition of Jim Crow laws on reducing inequities in infant death rates and implications for choice of comparison groups in analyzing societal determinants of health. Am J Public Health. 2013;103(12):2234-2244.

Chambers BD, Baer RJ, McLemore MR, Jelliffe-Pawlowski LL. Using Index of Concentration at the Extremes as indicators of structural racism to evaluate the association with preterm birth and infant mortality- California, 2011-2012. J Urban Health. 2019;96:159-170.

Wallace ME, Mendola P, Liu D, Grantz KL. Joint Effects of Structural Racism and Income Inequality on Small-for-Gestational-Age Birth. Am J Public Health. 2015;105(8):1681-1688.

Wallace M, Crear-Perry J, Richardson L, Tarver M, Theall K. Separate and unequal: Structural racism and infant mortality in the US. Health Place. 2017;45:140-144.

Abrams, E. M., & Szefler, S. J. (2020). COVID-19 and the impact of social determinants of health. The Lancet. Respiratory medicine, 8(7), 659–661. https://doi.org/10.1016/S2213-2600(20)30234-4


Appendix

Mean differences from ANOVA models
* Games-Howell post-hoc test statistically significant at the p <.001 level
Reference level: quartile 1 (low historic redlining)
A-1: Mean differences from ANOVA models of sociodemographic characteristics and COVID-19 health risk factors by quartile of national historic redlining score. First quartile is reference (I) in column one with comparison quartiles (J) in column two.

Comparison of the original 1937 HOLC categorization and grading of neighborhoods

Baltimore, MD 1

Baltimore, MD 2

Bay Area 1

Bay Area 2

Chicago, IL 1

Chicago, IL 2

Memphis, TN 1

Memphis, TN 2

Milwaukee, WI 1

Milwaukee, WI 2

New Orleans, LA 1

New Orleans, LA 2

Rochester, NY 1

Rochester, NY 2

St. Louis, MO 1

St. Louis, MO 2


[1] https://www.philadelphiafed.org/-/media/covid/which-neighborhoods-and-households-will-be-most-impacted/covid-19-impacted-households-neighborhoods.pdf?la=en

[2] https://www.cdc.gov/coronavirus/2019-ncov/need-extra-precautions/racial-ethnic-minorities.html

[3] https://www.philadelphiafed.org/-/media/covid/which-workers-will-be-most-impacted/covid-19-impacted-workers.pdf?la=en

[4] https://www.kff.org/coronavirus-covid-19/issue-brief/double-jeopardy-low-wage-workers-at-risk-for-health-and-financial-implications-of-covid-19/

[5] https://www.pewresearch.org/fact-tank/2020/05/05/financial-and-health-impacts-of-covid-19-vary-widely-by-race-and-ethnicity/

[6] https://www.urban.org/urban-wire/these-five-facts-reveal-current-crisis-black-homeownership

[7] https://www.huduser.gov/portal/sites/default/files/pdf/Federal-Housing-Administration-Underwriting-Manual.pdf

[8] https://www.archives.gov/federal-register/codification/executive-order/11063.html

[9] https://www.hud.gov/program_offices/fair_housing_equal_opp/fair_housing_act_overview

[10] https://www.federalreserve.gov/consumerscommunities/cra_about.htm

[11] https://www.ffiec.gov/hmda/history.htm

[12] https://dsl.richmond.edu/panorama/redlining/#loc=5/39.1/-94.58

[13] https://www.cdc.gov/coronavirus/2019-ncov/symptoms-testing/symptoms.html

[14] https://www.nytimes.com/interactive/2020/07/05/us/coronavirus-latinos-african-americans-cdc-data.html?smtyp=cur&smid=tw-nytimes

[15] https://www.google.com/url?q=https://www.smithsonianmag.com/science-nature/what-racism-public-health-issue-means-180975326/?utm_source%3Dtwitter.com%26utm_medium%3Dsocialmedia&sa=D&ust=1596284434786000&usg=AFQjCNE2qgosTXKyBW9AEcG_2KnvIsrWNQ

[16] https://dsl.richmond.edu/panorama/redlining/#loc=5/37.892/-99.316&text=about

[17] https://www.cdc.gov/500cities/index.htm

[18] https://www.naphsis.org/usaleep

[19] https://www.census.gov/acs/www/data/data-tables-and-tools/data-profiles/2017/

[20] https://www.cdc.gov/nchs/data/series/sr_02/sr02_181.pdf

[21] Lynch, E., Malcoe, H.M., Laurent, S.E., Richardson, J., Mitchell, B.C., Meier, H.C.S., The legacy of structural racism in Milwaukee: Associations between historic redlining, current mortgage lending, and health. submitted manuscript (2020)

[22] https://www.cdc.gov/coronavirus/2019-ncov/

[23] The CDC does not list high cholesterol as a condition that increases one risk of severe illness from COVID-19, However, literature does suggest cholesterol to be associated with COVID-19 infection and severity (https://www.ncbi.nlm.nih.gov/pmc/articles/PMC7340589/), thus, for this analysis we considered high cholesterol a risk factor of COVID-19 morbidity.

[24] https://www.cdc.gov/500cities/index.htm

[25] https://www.naphsis.org/usaleep

[26] https://svi.cdc.gov/

[27] https://svi.cdc.gov/

[28] Maps are presented at CBSA level quartiles for visualization purposes, while all other statistical analysis is completed using nationally calculated quartiles.

[29] https://www.dcpolicycenter.org/publications/mapping-segregation-fha/

Content warning: HOLC map descriptions from the 1930s use racial and ethnic language that may be offensive or disturbing.

HOLC data courtesy of the Digital Scholarship Lab at the University of Richmond.

How to use the Maps

When you select a city you will see two maps side by side.

Holc map 1

The one on the left will show the redlining map made by the Home Owners Loan Corporation during the 1930s. 

The map on the right shows the U.S. Centers for Disease Control and Prevention 2018 Social Vulnerability Index (SVI) scores for census tracts. The index is widely used to assess a community’s capacity to prepare for, respond to, and recover from human and natural disasters. The social and economic resources available to a community and its underlying vulnerabilities are key factors in how hard it may be impacted by a disaster.

Between the maps you’ll see a diagram.

vulnerability score

The rectangles on the left are color-coded by grade from the 1930s HOLC map. On the right, census tracts are plotted by their SVI score. The paths between them connect the same areas across time and show continuities and changes. 

Click on either the map of the rectangles on the chart to select an area in the past or today to view more details. The bottom will show several charts situating the demographic, economic, and health data for the census tract in comparison to other tracts in the city.

Each dot represents a census tract or, if a HOLC area is shown, an estimation of the overlapping census tract areas. The label for the graph can be selected to map that variable, e.g. asthma rates, and the dots can be clicked to select the tract.

Print Friendly, PDF & Email
Scroll to Top

Redlining and Neighborhood Health

Complete the form to download
the full report: