April 8, 2020
NCRC supplemental comment on proposed CRA evaluation measure using Federal Reserve CRA data
Notice of Proposed Rulemaking (Docket ID OCC–2018-0008 and RIN 3064-AF22)
Reforming the Community Reinvestment Act Regulatory Framework
To Whom it May Concern:
The National Community Reinvestment Coalition (NCRC) is submitting another comment on the proposed changes to the Community Reinvestment Act (CRA) focused on NCRC’s analysis of the Federal Reserve’s CRA database. The Federal Reserve released a database on CRA exams from 2005 through 2017 in early March.[1] The database presents CRA data on retail lending and community development lending and investing for a large sample of 6,300 CRA exams.
Focusing on the proposed CRA evaluation measure, NCRC’s analysis of the Federal Reserve database suggests that the OCC and FDIC must withdraw its proposal. The analysis of Federal Reserve data indicates that the proposed empirical benchmarks for the CRA evaluation measure would not improve CRA performance or increase retail lending or community development activity for banks with assets above $1 billion.[2] Instead, the historical data suggests that these banks would be able to relax their CRA efforts and either maintain stagnant performance or decrease their retail lending and community development financing.
Under the Notice of Proposed Rulemaking (NPRM), a bank would receive a presumptive rating of Satisfactory if its CRA evaluation measure is 6% of deposits and a rating of Outstanding if its measure is 11% or more.[3] The Federal Reserve database contains data on an assessment area (AA) level so the NCRC analysis reveals performance on an AA level. Under the proposal, the CRA evaluation measure would be applied at the bank level and at an AA level. This analysis reveals the likelihood of banks readily achieving acceptable scores at the AA level and by implication, at the bank level.
Table 1 below reveals the median AA ratios for different time periods. The Federal Reserve database had most, but not all of the data that would be used for the ratio. It had the dollar amount of home loans reported under the Home Mortgage Disclosure Act (HMDA) for low- and moderate-income (LMI) borrowers and the dollar amount of small business and farm loans made to enterprises with revenues less than $1 million and in LMI tracts. It also had data for dollar amounts of community development (CD) loans and investments. Retail lending and CD loans and investments comprised the numerator of the ratio, which would be divided by the dollar amount of deposits (see the methodology appendix below for more detail). The ratios calculated using Federal Reserve data most likely underestimate actual ratios because they did not include consumer loan data, which the NPRM indicates would be collected and be part of the ratios.
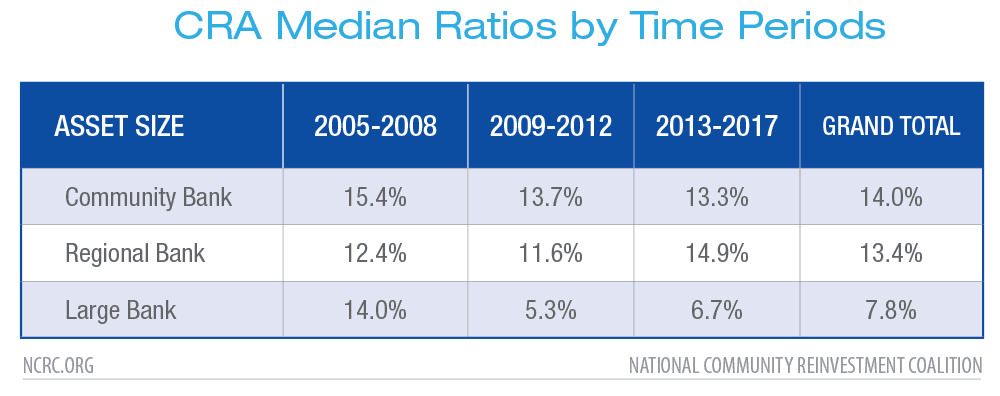
Although underestimates, the historical ratios indicated that community banks with assets between $1.226 billion[4] and $10 billion had a median AA ratio of 14% over the entire time period of 2005 through 2017. Interestingly, the ratios did not differ too much during the pre-crisis years of 2005-2008, the financial crisis years of 2009-2012, or the post crisis years of 2013 through 2017. The pattern was similar for regional banks with assets between $10 and $50 billion; these banks had a median AA ratio of 13.4% over the entire time period.
In contrast, large banks with assets over $50 billion had median AA ratios that dropped dramatically during the financial crisis and did not recover. Their median AA ratio was 14% from 2005 through 2008. The median ratio decreased to 5.3% from 2009 through 2012 before rising modestly to 6.7% from 2013-2017.
During significantly different economic conditions, community and regional banks exceeded the 11% Outstanding level in the NPRM. The large banks exceeded the Satisfactory level of 6% except during the financial crisis years. In more expansionary economic conditions during the pre-crisis years, the large banks handily surpassed the proposed Outstanding level.
Table 1, however, did not account for the multiplier proposed by the agencies. For many CD activities, the agencies proposed to multiply the dollar amount of activities by two in order to encourage these activities. The Federal Reserve database did not have enough information on different types of CD loans and investments to allow NCRC to be able to multiply only the activities that the OCC and FDIC had proposed would receive double credit. Thus, NCRC presents two tables: one without CD activities multiplied by two and one with all CD activities multiplied by two.

The ease of passing the proposed benchmark ratios increases when all CD activities were multiplied by two as shown in Table 2 above. For example, the community bank median AA ratio for 2005-2017 was 16.8%; it was 15.1% for regional banks. Large banks had a median of 8.9% for 2005-2017, which is comfortably above the proposed Satisfactory level. The actual levels would be somewhere in between the ranges in tables 1 and 2. The implication remains that the proposed ratios are too low.
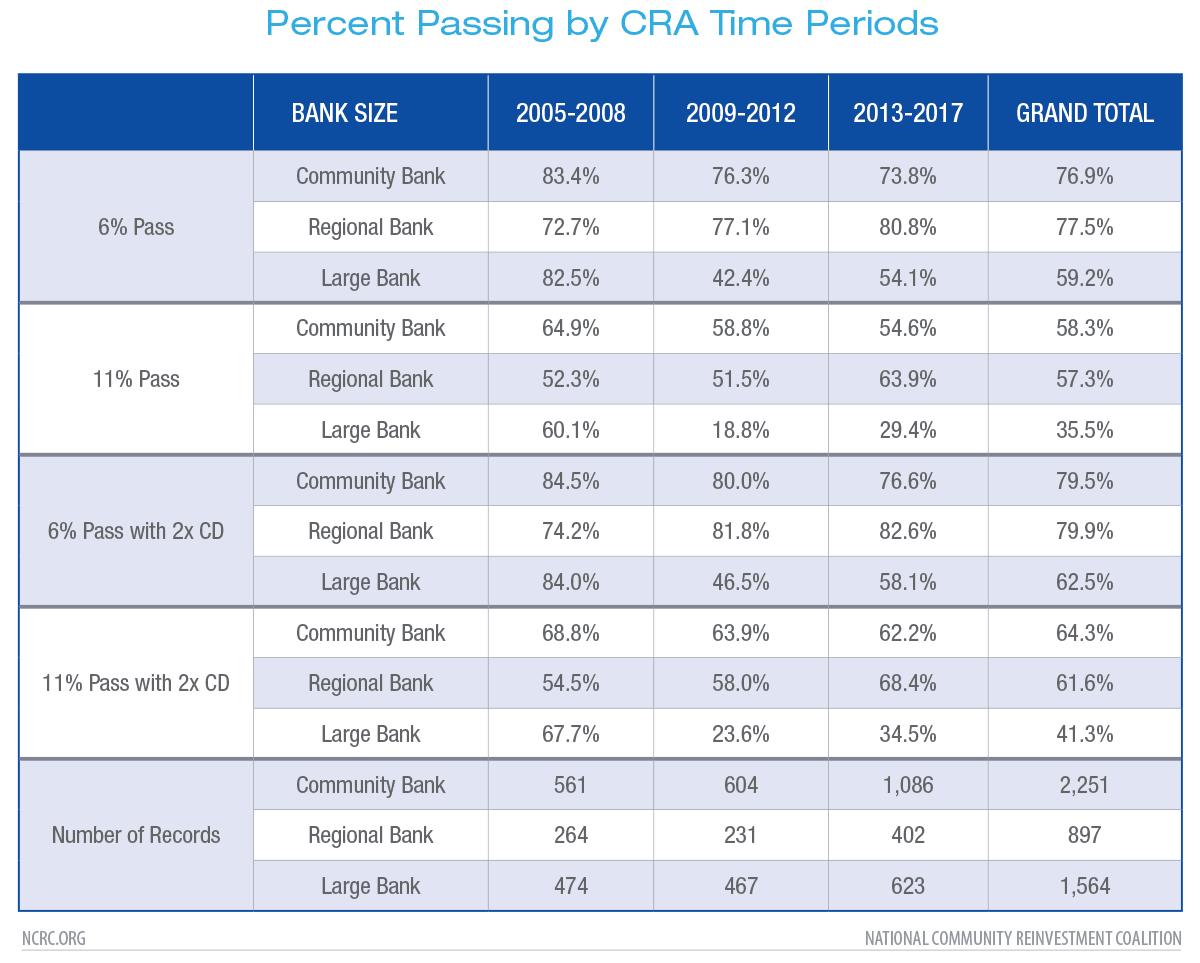
Table 3 shows the number of observations in the NCRC analysis. The number of observations are large enough to afford robust conclusions.

Another way to assess the rigor of the proposed CRA evaluation measure is to estimate the percent of AAs in which banks of various asset sizes in different time periods would achieve the Satisfactory ratio of 6% and the Outstanding ratio of 11%. Table 4 below shows that all the banks would achieve the 6% or higher ratio in the great majority of their AAs. For the entire time period of 2005-2017, community banks and regional banks would achieve a 6% or higher ratio in 76.9% and 77.5% of their AAs, respectively. For the entire time period, large banks pass with 6% or higher in 59.2% of their AAs. They pass in less than half of their AAs in just the financial crisis years of 2009 through 2012. Community and regional banks achieve the proposed Outstanding ratio of 11% or higher in almost 60% of their AAs and large banks do so in 35.5% of their AAs from 2005-2017.
When multiplying CD dollar amounts by two, the pass rates increase. Community banks and regional banks achieve Satisfactory or higher ratios in almost 80 percent of their AAs. Large banks hit these marks in 62.5% of their AAs from 2005-2007.
Overall, unless the economic conditions equal or are worse than those during the Great Recession, all banks would pass in more than 50% of their AAs. The agencies proposed to allow banks to pass in just half of their AAs and still pass overall. The proposed ratios are not rigorous and would not motivate increases in CRA loans and investments for LMI communities.
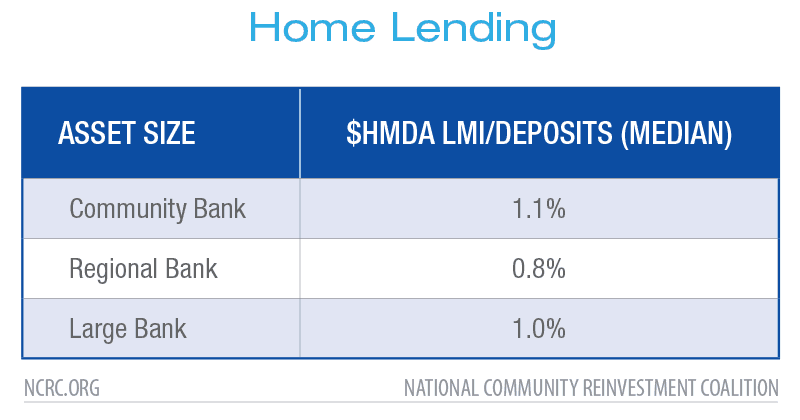
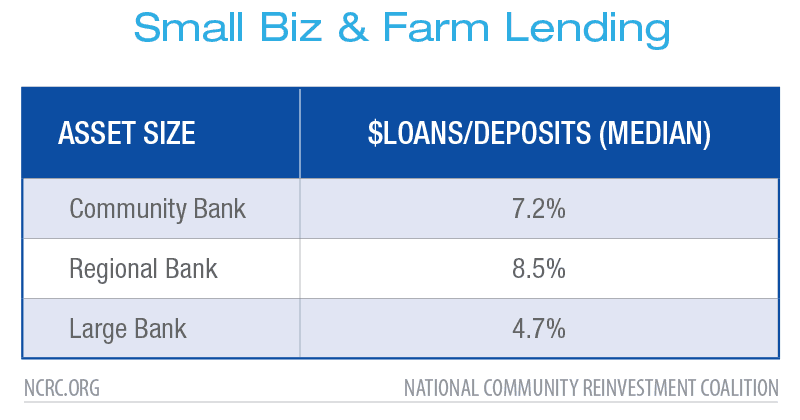
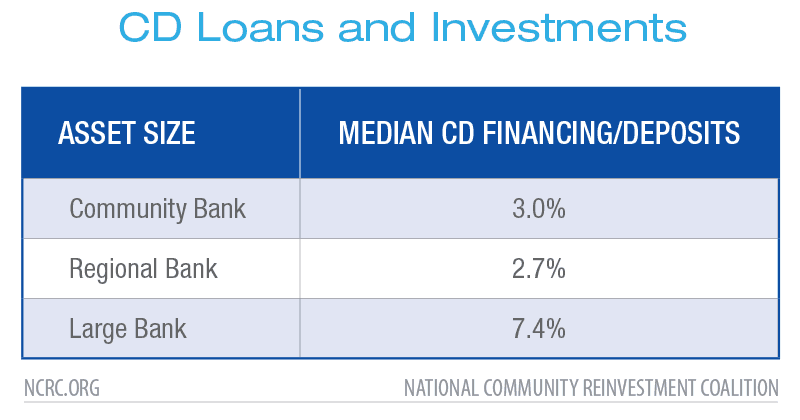
Tables 5 through 7 display the components of the ratios for the different types of banks. Table 5 suggests that retail home lending to LMI borrowers would not contribute much to the numerator. In contrast, small business and farm lending and CD financing would have contributions that are more robust as shown in Tables 6 and 7. For example, small business and farm lending had an AA median level of 8.5% of deposits for regional banks from 2005-2017. Table 7 reveals that for large banks, CD lending and investing was an AA median of 7.4% of deposits. This is worrisome because it would invite gaming behavior.
Under the NPRM, the agencies propose to raise the revenue threshold for defining a small business from $1 million to $2 million.[5] The historical performance, illustrating success with offering small business and farm loans, combined with this re-definition would likely encourage banks to increase significantly lending to the larger businesses and farms in order to boost further their ratios.
A similar dynamic would occur with community development financing. Banks would be tempted to build on their success in large dollar financing by emphasizing financing essential infrastructure, which could include major metropolitan-level projects like large bridges that do not directly revitalize LMI communities.[6] Table 7 also suggests that most banks were already above the proposed 2% minimum for CD financing[7], indicating that this minimum would be ineffective in promoting consistent and additional CD financing.
Conclusion
The review of data from the Federal Reserve database suggests that the OCC’s and FDIC’s proposal is not grounded in rigorous data analysis. The historical data in the Federal Reserve database reveals that banks are already meeting or surpassing the proposed benchmarks for Outstanding and Satisfactory at an AA level and likely at an overall bank level. In addition, this analysis of the Federal Reserve database supplements NCRC’s analysis described in detail in an accompanying comment letter revealing that the proposed benchmarks and tests would lead to either stagnant or declining levels of CRA activity and performance. This is contrary to CRA’s statutory mandate that banks continually and affirmatively meet credit and banking needs of communities.
Finally, the proposed CRA evaluation measure discards important qualitative factors on CRA exams and would lead to banks disproportionately financing activities that are not directly responsive to needs in LMI communities. For example, banks would be encouraged to build on their current success in CD financing by favoring large general infrastructure projects like bridges. The proposed benchmarks for the CRA evaluation measures are not only easy for banks to pass, but would likely divert banks from the most pressing needs in LMI communities. The agencies must discard the proposed CRA evaluation measures.
If you have any questions, please contact us or Josh Silver, Senior Advisor, on 202-628-8866. Thank you for the opportunity to comment on this important matter.
Sincerely,
Jesse Van Tol
CEO, NCRC
John Taylor
President and Founder, NCRC
Methodology Appendix
The Federal Reserve database presents data on an AA level for a sample of CRA exams from 2005 through 2017 as described in the User Guide: CRA Analytics Data Tables.[8] NCRC used the “Merged dataset” that contained data retrieved from CRA exams, the Home Mortgage Disclosure Act (HMDA) data, and CRA data on small business and small farm lending. As described above, NCRC calculated median AA ratios for various categories of banks and for different time periods. NCRC adopted the asset categories of banks from a study conducted by Calem, Wachter, and Lambie-Hanson.[9] They found that these categories of banks performed differently in home lending and our study revealed that they also had different ratios of CRA activity. NCRC choose time periods to reflect various economic conditions based on a study conducted by Bostic, Ding, and Lee.[10]
NCRC could not use data for intermediate small banks (ISB) because these banks did not have data on retail lending in the Federal Reserve database. Small banks with revenues below the ISB category were also not in the analysis.
The numerator of the ratio conforms as closely as possible to that in the FDIC’s and OCC’s proposed CRA evaluation measure. It consists of the dollar amount of HMDA loans to LMI borrowers, CRA loans (small business and small farm loans) in LMI tracts and to entities with less than $1 million in revenue. NCRC adjusted for double counting by subtracting the variables of loans in LMI tracts to entities with less than $1 million in revenues from the numerator. The numerator also includes community development loans and investments. The denominator consists of the dollar amount of deposits.
The variables in the Federal Reserve dataset are not complete for the purposes of an analysis of the proposed OCC and FDIC evaluation measure. First, the dataset does not include consumer lending, which is not publicly disseminated like HMDA data. Second, not all the data is parallel in that when loan origination data is available, data on loan purchases or data on affiliate activity may not be. For example, the dataset does not contain data on affiliate loan originations to small businesses and farms with revenues less than $1 million. The dataset also does not have loan purchase information regarding businesses or farms with less than $1 million in revenue. Finally, the dataset does not have information on loan purchases to small businesses or farms with revenues less than $1 million in LMI tracts.
CRA exams or data were not designed for calculations of the proposed CRA evaluation measure so this likely explains the gaps present in the data. All told, since consumer loan data is not included and loan purchase and affiliate data is inconsistent, the NCRC ratio calculations are probably under-estimates.
NCRC used the following equation to calculate the numerator of the ratios:
H_in_bL_3 + H_in_bL_4 + H_in_bL_7 + H_in_bL_8 + C_in_bL_3 + sb_in_tL_3 + sb_in_tL_4 + sb_in_tL_7 + sb_in_tL_8 + sf_in_tL_3 + sf_in_tL_4 + sf_in_tL_7 + sf_in_tL_8 + pcd_3_investment + pcd_3 PE ) – (sb_in_bLtL_3 + sf_in_bLtL_3)
The Federal Reserve’s resource called Data Dictionary – Merged Data Table | CRA Analytics Data Tables provides the description of these variables.[11]
[1]Federal Reserve Board publishes Community Reinvestment Act Analytics Data Tables, March 6, 2020, https://www.federalreserve.gov/newsevents/pressreleases/bcreg20200306a.htm.
[2] The intermediate small bank category of $307 million to $1.226 billion (2017 asset thresholds) did not have retail lending data in the Federal Reserve database so NCRC could not generate ratios for them.
[3] Office of the Comptroller of the Currency (OCC) and Federal Deposit Insurance Corporation (FDIC), Joint Notice of Proposed Rulemaking (NPRM), Community Reinvestment Act (CRA) regulations, Docket ID OCC-2018-0008 & RIN 3064-AF22, pp. 1220 and 1221, https://www.regulations.gov/document?D=OCC-2018-0008-1515.
[4] NCRC had to use $1.226 billion as the cut-off because retail lending data was not available for banks below his asset level. See methodology appendix below.
[5] NPRM, p. 1211.
[6] Ibid.
[7] NPRM, p. 1222.
[8] Board of Governors of the Federal Reserve System, User Guide: CRA Analytics Data Tables, March 6, 2020, https://www.federalreserve.gov/consumerscommunities/files/cra-data-tables-user-guide.pdf
[9] Paul Calem, Lauren Lambie-Hanson, Susan Wachter, Is the CRA Still Relevant to Mortgage Lending, Penn Institute for Urban Research, September 2019, https://penniur.upenn.edu/uploads/media/Calem_Lambie-Hanson_Wachter.pdf.
[10] Lei Ding, Raphael Bostic, and Hyojung Lee, Effects of the CRA on Small Business Lending, Federal Reserve Bank of Philadelphia, WP 18-27, December 2018, https://www.philadelphiafed.org/-/media/research-and-data/publications/working-papers/2018/wp18-27.pdf
[11] This data dictionary and others for the Federal Reserve datasets can be obtained via https://www.federalreserve.gov/consumerscommunities/files/cra-data-tables-data-dictionary-documentation.zip. The data itself can be obtained via https://www.federalreserve.gov/consumerscommunities/files/cra-data-tables.zip
