Redlining The Reservation:
The Brutal Cost Of Financial Services Inaccessibility In Native Communities
December 2023
Photo: ©Mylo Fowler via NCC
Summary
The Community Reinvestment Act of 1977 sought to address the practice of redlining – the intentional exclusion by banks of minority, immigrant and poor communities from financial services. In late 2023, new CRA regulations specifically included Native Land Areas for the first time. This paper sets a baseline for measuring access to capital by tribal communities in hope of a more just financial services landscape in Indian Country.
In this report, our use of the term “redlining” adheres to its historical definition rather than a strict legal one. In this context, redlining encompasses the practice of denying creditworthy applicants housing loans in specific neighborhoods, irrespective of their eligibility. This use embraces the broader historical implications of redlining, including not only racial discrimination but also its impact on tribal lands and other factors.
Key Takeaways:
Traditional mortgage lending is failing Native American families so egregiously that loan capital should instead flow through Native-led financial institutions that are attuned to the administrative issues, geography and culture of tribal lands. None of the three largest home lenders in the US issue federally-guaranteed mortgages for the construction of new permanent homes within tribal lands. Little of the credit that is being made available is promoting wealth-building in the ways that financing can when routed through Native Community Development Finance Institutions (CDFIs) often focused exclusively on addressing the lack of access to capital in tribal communities.
Half of all home purchase loans on tribal lands are used to purchase manufactured mobile homes – four times the rate elsewhere. Native Americans who succeed in getting a mortgage at all are often using that capital to purchase a dwelling that will decrease in value rather than foster generational wealth-building.
- The wealth stripped out of already-impoverished Native communities via high-cost lending on low-value housing is accruing almost entirely to the empire of billionaire financier Warren Buffett, whose firms have a monopoly on manufactured home lending in our study area.
Tribal lands received less than one cent for each dollar loaned to small businesses in Arizona and New Mexico, starving Native American communities of economic opportunity. From 2018 to 2021, just 0.004% of small business dollars loaned in Arizona – and 0.012% in New Mexico – went to borrowers on tribal lands. The average census tract on tribal land received just five small business loans, compared to 82 such loans made on average to non-tribal tracts.
Tribal areas have far higher quantified financial need than other rural areas. Tribal areas have high quantified financial need. The financial needs index indicates significantly worse access in tribal areas, meaning that people living on Tribal Lands are not being served nearly as well as other residents of Arizona and New Mexico.
Authors
Dave Castillo, Chief Executive Officer, Native Community Capital (NCC)
Bruce C. Mitchell, PhD, Principal Researcher, NCRC
Jason Richardson, Senior Director, Research, NCRC
Jad Edlebi, GIS Data Engineer, NCRC
This report was produced with support from Native Community Capital.
Introduction
Citizens on tribal lands live starkly different lives from Americans living in other areas: Tribal areas face infrastructure challenges not only in transportation connectivity and internet access, but in basic quality-of-life necessities like electricity, fresh water, sanitation and heating/cooling systems.
If families and businesses in tribal areas could access the economic opportunities available elsewhere, Native communities could address these hardships themselves. But the scale of the problem demands massive direct investment – a sort of Marshall Plan for Indian Country – in order for tribal communities to manufacture their own salvation.
Crafting such a plan effectively is impossible if its authors can’t see the shape of the problem, which is itself a monumental challenge. Measuring the investment gaps across Indian Country is difficult because data on access to capital, lending decisions and loan outcomes on tribal lands has been scarce for decades. And the Census data that forms the bedrock of comparative econometric analysis is curiously skewed when it comes to Native Americans and the places they live – both because of longstanding issues with the relative accuracy the Census Bureau can achieve on tribal lands, and because of a near-doubling in the number of Americans who identified as Native American from the 2010 to 2020 censuses.
The resulting blind spot in the public understanding of economic realities for Native Americans has hampered policymaking efforts for generations – and exacerbated the broader neglect and disinterest that most political actors have demonstrated toward those still living near lands stolen from them during and after the westward expansion of the United States. If no one knows what’s happening, after all, nobody feels compelled to do much of anything about it. Researchers at the University of Michigan identify this phenomenon as a “distinct form of bias that undermines Native Americans’ opportunities and wellbeing: bias of omission. Biases of omission refer to the ways in which Native Americans are written out of public consciousness.”
We sought to address this analytic blind-spot through a detailed analysis of census tracts which overlap tribal territories in Arizona and New Mexico. Our study area is home to roughly 338,000 of the five million Americans living on tribal lands nationwide. What we found about the financial industry’s effect on those 338,000 lives is at once alarming and predictable: Native people are all but severed from the financial infrastructure upon which this country runs.
Cutting Off Economic Lifelines
Financial access for individuals and businesses is a crucial component of the dominant economic system at work in the United States. It is the oxygen that allows local communities to grow and thrive – and the banking and lending systems have replaced economic lifelines with persistent redlines that bar Native Americans from crucial financial access.
When our financial infrastructure operates equitably, it allows citizens to access credit to finance home purchases, build credit histories and purchase vehicles. It is also essential for the operation and expansion of small businesses, providing credit for maintaining inventory, financing building expansion and equipment purchases. Financial access is necessary for a functioning market in which individuals, families, businesses and the larger community can prosper.
Communities with low levels of financial access face higher barriers to their robust economic development. When lending and depository services are out of reach, the harmful consequences don’t just prevent individual families from pursuing homeownership or realizing their small business ideas. They also impair the political, economic and social institutions those individuals create together from exercising the self-determination that other Americans enjoy. Tribes and their citizens are both participants in this system, and prey for its largest and richest corporate actors. The lack of financial access in tribal areas is a more modern, more technical iteration on a grim history of victimization through which Native American people have had to persist for centuries. Tribal areas, also known as American Indian Reservations[1], are the last vestiges of vast lands stolen by colonists to form what is today the United States. They are also a demonstration of the enormous resilience of Native American people. In a rebuke to the notion of the Vanishing Indian[2], today tribes maintain primary governmental administration over tribal areas and are actively rebuilding their remaining land base. That process is frustrated by difficulties accessing capital for home mortgage lending, small business operations and the development of infrastructure in many tribal areas.
The causes of the financial access crisis on tribal lands are complex, an intersectional storm of historical, geographic and economic issues. The issues originated with a genocidal campaign against tribes by colonial powers, were compounded in the resulting treaties and Presidential Executive Orders and finally codified in today’s Federal-Indian jurisprudence, widely regarded as the most convoluted body of law in the country. This fraught history has resulted in unsettled relations – economic and otherwise. As recently as June 22, 2023, the United States Supreme Court refused to hold the United States accountable for water rights it holds in trust for the Navajo Nation.
Today, a mixed structure of federal and tribal governance defines economic and other activities on tribal lands where “Native Americans live under fundamentally different institutions than other Americans.”[3] They are neither fully American institutions nor the original form of governance, economic, social and religious institutions Native people maintained prior to their first contact with White colonialism.[4] Some of the most successful contemporary Nation-building efforts by tribes are those that are rooted in the belief systems that define a particular tribal community since time immemorial while also incorporating some western based institutions of the now dominant culture.[5] Research on improving social conditions in many tribal areas suggests their economic development can be enhanced by strengthening institutions to increase self-determination and self-governance of Native nations.[6] CDFIs, for example, offer a conduit for investment on tribal lands by way of the Native Initiatives program of the CDFI Fund. Authorized by the Riegle Community Development Banking and Financial Institutions Act of 1994, Native CDFIs receive funding and training to bridge the gap left by traditional financial institutions in tribal communities.
The geographic isolation of many tribes and the systemic lack of modern amenities on their lands create additional challenges. Many tribal areas are in remote rural locations, limiting their connection with outside communities, including their access to financial services and to economic exchange.[7] The popular sense of how tribes are faring is warped by this disconnectedness: The bulk of Native American humanity is invisible to other Americans, while the handful of more-visible tribes located near metro areas are perceived to be accruing significant wealth. In reality, most Native Americans living within the richest economy on Earth reside in pockets with less opportunity than many developing countries. The Navajo Nation ranked in the bottom 15% for business development activity in an analysis of 190 world economies conducted by an entrepreneur support organization based there. Specifically, the analysis found that it is more difficult to access land, get a new electrical connection, or enforce contracts on Navajo than almost anywhere else in the world.[8]
Mapping The Problem To Make It Solvable
The signature finding of this report is a never-before-assembled Financial Needs Index (FNI). FNI is a comprehensive measure of the level of access to services currently observable in a given area or community. NCRC developed the FNI to assist banks and credit unions with selecting locations for new branches. It should be understood as a guide to where new bank or credit union branches would be best sited to foster economic growth that is currently impaired or impossible for want of services and capital. The FNI factors in a wide range of variables, including but not limited to population density, minority percent of population, internet and smartphone access, vehicle ownership rates and distances to the nearest existing brick-and-mortar bank or credit union.
Our analysis produced maps showing where branch services, loan capital and other key markers of a healthy local economy are available. Coupled with economic, historic and policy insights we are gathering from testimonial interviews in these communities, this work reveals the impact of unmet financial need on the lived reality of citizens across Arizona and New Mexico.
While long understood in the abstract, we have now quantified the intensity of the disparities in financial services access based upon how near or far a given person lives to tribal areas. These maps should be used by policymakers, advocates and financial institutions to guide investment in services and products that can close these gaps.
The hotter the color of a given area, the more highly it should be prioritized in these efforts. Cooler-colored areas are not necessarily receiving too much attention from the industry, regulators and service providers. But when scarce resources must be allocated, the red, orange and yellow areas of these maps should be at the front of the line.
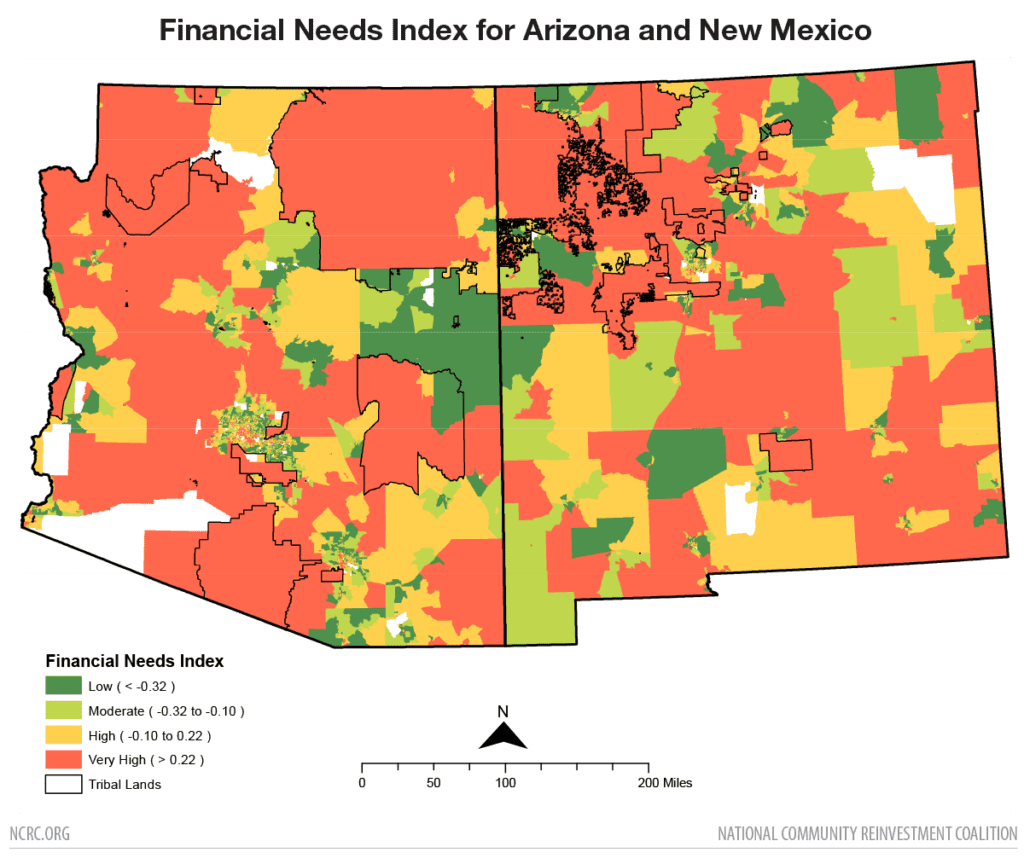
Figure 1
Failure Is Fatal – Literally
This concentration of disadvantage in many tribal areas also manifests in various ways beyond economic and social conditions, including the most fundamental aspect of a good life: human health. Native Americans have the lowest life expectancy of any major racial and ethnic group in the US.[9] The average Native American lives 71.8 years, dramatically below the average life expectancy of non-Hispanic White Americans (78.8 years), non-Hispanic Black Americans (74.8 years) and Hispanic Americans (81.9 years).[10] In Arizona and New Mexico the co-occurrence of concentrated disadvantage and lower life expectancy in tribal areas is immediately apparent when mapping available data (Figure 2). Ultimately, without adequate investment, the compounding effects of deprivation undermine the social determinants of health for tribal communities, shaping everything from early childhood education to quality housing and jobs, access to health clinics and healthy food, sustainable energy and safe transportation.
While the severity of circumstances is intense for nearly all tribal communities, there are differences of degree that produce variations of economic development and financial access across Native American nations. This report assesses some of the challenges faced by people living in tribal areas, first examining the issues impeding financial access, then how these issues create specific vulnerabilities to predatory lending practices, and finally suggesting some solutions to alleviate these problems.
Our findings illuminate the broad failure of current practices to meet Native American financial needs, with a special focus on three key areas.
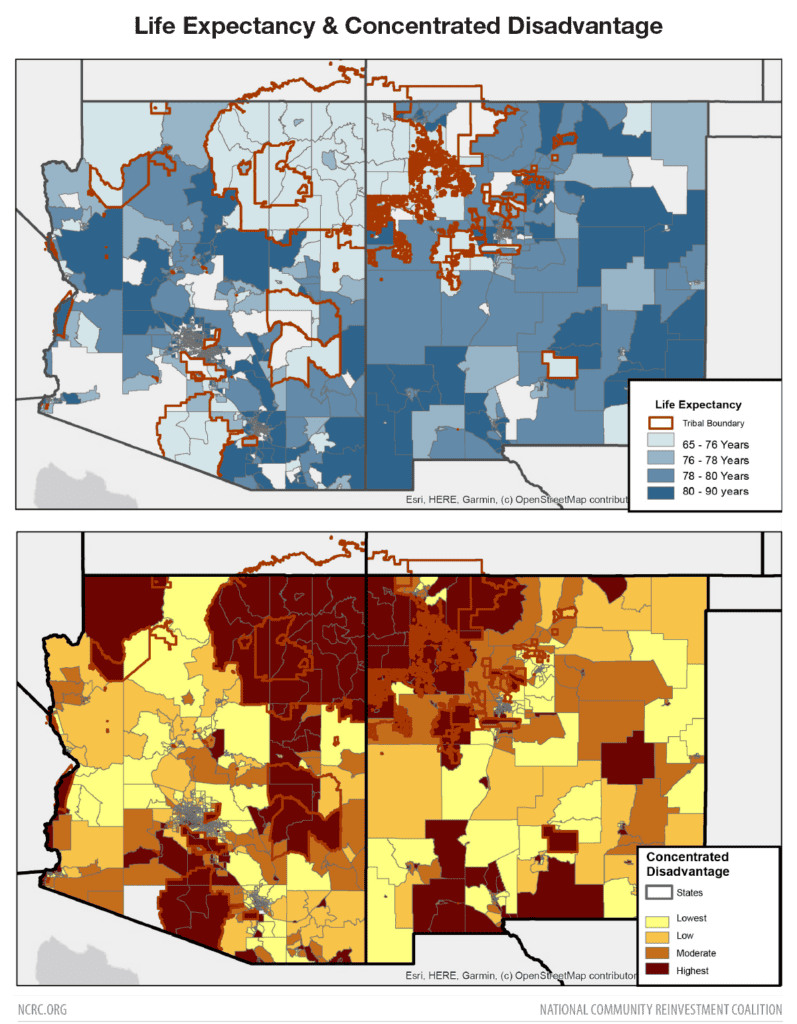
Figure 2
Mortgage Lending:
- Private finance all but refuses to facilitate conventional mortgage lending in Indian Country even though they would face zero risk of losses on such lending, thanks to a federal program that offers lenders a 100% guarantee against loss on such credit. Zero of the three largest mortgage lenders in the country participate in the Department of Housing and Urban Development’s (HUD) Section 184 program of absolute loan guarantees on mortgages made in tribal areas. Just 2,200 loans have been made under that program each year on average, across the entire nation.
- By choosing to abandon would-be homeowners on tribal lands despite facing no risk on such loans, the private finance industry has made Native Americans highly dependent on manufactured housing. On tribal lands in Arizona and New Mexico, 49% of home purchase loans were used to buy manufactured homes. In census tracts without tribal land, this figure fell to just 4%.
- Lenders are compounding the wealth-destroying effects inherent to a manufactured home by imposing far higher costs on such borrowers than on those who are able to access the wealth-building opportunity of a site-built home. Loans on manufactured homes tend to carry much higher interest rates – in part because there is no meaningful competition in that market, where Warren Buffett’s Berkshire Hathaway owns both of the dominant lenders.[11]
Small Business Lending:
- American Indian Alaskan Native (AIAN) people are less likely to own a business that employs at least two people than any other demographic group save for African Americans. While there were more than 40,000 AIAN-owned employer firms in 2020, that is just 0.69% of all such firms.
- Vanishingly few of the total firms located in Arizona and New Mexico are on tribal lands, showing a lack of economic development in tribal areas. This failure to facilitate localized virtuous cycle cashflow economies in tribal areas is part of why those parts of the two states have the highest concentration of low- and moderate-income (LMI) households.
- Tribal areas receive a fraction of small business loans compared to non-tribal areas. An average of only 5 loans were made for each LMI tract in tribal areas over four years, contrasted with 82 loans per LMI tract in non-tribal areas. Even in middle- to upper-income tracts, lending is significantly less in tribal areas.
- Tribal areas in Arizona and New Mexico received only 0.004% and 0.009% of small business loans made from 2018-2021, reflecting the severe underdevelopment and capital access deficit on tribal lands.
Pandemic-related Lending:
- The COVID-19 pandemic disproportionately affected tribal areas, especially the Navajo Nation in Arizona and New Mexico. The impact was heightened by higher risk factors like asthma, diabetes, obesity and a lack of infrastructure, leading to increased morbidity and mortality rates.
- Paycheck Protection Program (PPP) lending between 2020-2022 provided crucial support to key employers and providers of essential services, including casinos, restaurants, hotels, electrical power corporations and tribal governments. For instance, $22 million in PPP loans to casinos supported 2,300 workers and another $15 million to restaurants supported 2,500 employees.
- Tribal lands in Arizona and New Mexico received 5% of PPP loans in those states, totaling $128 million with a high average loan amount of $208,000. Tracts without tribal land received almost eight times as much PPP capital ($921 million), with a far lower average amount lended ($92,000).
Policy Recommendations
While one can argue that capital flows to where there is demand, that is a misleading explanation of – and paltry excuse for – the material privation documented in this report.
Although there is much work to do, tribes and their allies do not need banks to do work they can do themselves. However, the plain fact is that the work needs serious, significant and sustained investment to make up for centuries of active exploitation by the US government, and decades of active neglect by the private sector.
Here are steps that policymakers should take to erase the persistent red lines financial institutions seem content to hide behind, so that residents of Indian Country might finally stop being left ever farther behind their non-Indian neighbors:
- Position Native-led institutions to direct effective capital and services to meet financial needs that traditional institutions are neglecting in tribal areas. The manifest failures documented in this report are unlikely to be fixed through revising the incentive structures under which traditional financial institutions operate, as the negligible uptake rate of fully-guaranteed Section 184 mortgage lending on tribal lands indicates. Policymakers should instead direct resources to Minority Depository Institutions, Native-owned banks, Native CDFIs[12] and entrepreneur and homeowner support organizations which specialize in credit repair[13] and offer niche lending products for tribal citizens living on tribal lands. This should include significant increases in the allocation of federal capacity-building funds and resources for Native American CDFIs as well as Native-led small business incubators and a broader eco-system of organizations building the administrative infrastructure necessary for a more equitable economic landscape. By bolstering these institutions – and exploring new models not yet in existence such as tribally chartered Housing Finance Authorities – we can ensure that residents of tribal lands receive tailored financial education, support and credit repair services that can help address the longstanding economic disparities in these communities.
- Implement all 21 specific policy recommendations from the latest Native Nations Institute (NNI) report on capital access issues facing tribal communities. Although the recommendations are heavily focused on actions tribes can take, little will change without willing and engaged bank and private sector partners. And where banks are unwilling and disengaged, bank regulators must take corrective actions early and often.
- Stop allowing the Government-Sponsored Enterprises (GSEs) to ignore their legal obligation to provide a secondary market for manufactured home loans. Existing legal tools including the Duty to Serve provisions of the Housing and Economic Recovery Act of 2008 can help counter the harmful monopoly effects of the current manufactured home loan market. Each of the GSEs operate programs that could be brought to bear on the issues detailed in this report – “Homeready” and “HFA Preferred” systems at Fannie Mae, and “HomePossible” and “HeritageOne” systems at Freddie Mac – but a thorough assessment of their current performance is necessary to identify where change may be required.
- Use the year-long on-ramping period for new Section 1071 small business loan data collection rules to fund studies that will generate a more robust understanding of how that much-anticipated data can be best used to assist economic development for AIAN communities. The methodology used in this report to clarify needs in Arizona and New Mexico is easily replicable in other states where tribal lands are concentrated. If such studies are conducted during the time period where lenders are coming into compliance with the Section 1071 rules, then policymakers and local institutions will be able to make faster and more informed use of those datasets when they become available over the next two years. Each of the promising use-cases for that data would be realized far more quickly if this assessment of the status quo has already been conducted by that time: Regulators and advocates who will use this data to identify discriminatory lending practices would be able to deliver more targeted, better-informed cures to such discrimination. Lenders who will use the data to identify untapped markets in Native lands would have a clearer understanding of those markets on “day one.” And researchers who will use the data to analyze how Native-owned businesses are faring with significantly less lending from traditional banks would likewise begin their work on stronger footing.
- Prioritize enforcement of Community Reinvestment Act (CRA) rules connected to Native Land Areas. The recently unveiled final rule modernizing implementation of CRA includes promising provisions to promote community development activities on tribal lands. CRA examiners and other public officials tasked with enforcing those new rules should elevate the Native Land Areas component of their assessments so that banks do not continue to neglect them. Such vigorous enforcement – including more robust rewards for institutions that do originate high percentages of their total community development financing in Native Land Areas – would further stimulate lenders to address the heightened need for community development loans and investments.
A Complex And Unique Context
Native traditions combine with peculiarities of the law — both in basic property rights and in governance structures — to create radically different market conditions on tribal lands. But while lenders’ recalcitrance to engage with those potential customers may be understandable on the surface, lawmakers have taken explicit steps to cure that fear of loss.
Site-built home mortgages on tribal lands are 100% guaranteed by the federal government — but mortgage lenders still refuse to extend credit there. As a result, many of the relatively small share of Native Americans who own their residence are living in manufactured homes that will depreciate in value rather than build familial wealth.
And on top of that inefficient and unhealthy outcome, the lenders who are willing to work with them at all charge them dramatically more for that depreciating asset than they charge others to obtain a permanent, wealth-building traditional house or apartment — sometimes by as much as $107,000 over the life of the loan. The lifestyle obtained through this exorbitant pricing differential is far from dignified: Native Americans who do own their homes are six times as likely as the national average to lack plumbing and heat, and eight times as likely to live in an overcrowded home.
Similar issues plague credit availability for farmers and small business owners on tribal lands. And Native Americans have far less access to basic financial services — both in average distances to banks (12.2 miles) and ATMs (6.9 miles), and in their access to internet connections.
Quantifying the human scale of the hardships facing AIAN communities has posed special research challenges for decades. But recent changes to census methods have added even more noise to the data: The number of census respondents identifying as Native American nearly doubled from 2010 to 2020, when the Bureau changed how census-takers ask about race and ethnicity. It is unlikely that the census counts accurately depict the true growth rate in the number of human beings directly affected by the issues studied here.
A full literature review detailing these and other key contextual issues on tribal lands can be found in Appendix A to this report. The methodology and data used in our analysis are described in Appendix B.
Results
Home Mortgage Lending
Understanding Loan Applications by Native Americans in Arizona and New Mexico
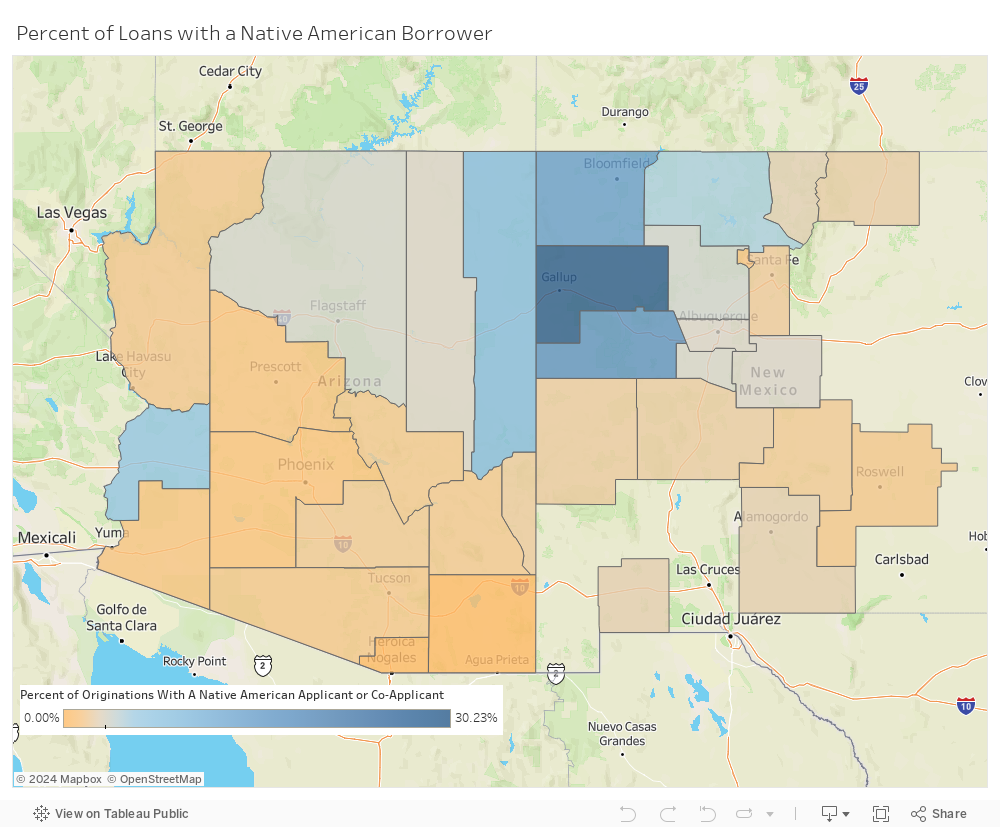
Figure 3
In New Mexico, three counties have the highest percentage of Native American mortgage loan applicants. McKinley County leads with an impressive 42.62% of applications from Native Americans, totaling 3,637 applications. Close behind is Cibola County, where 21.20% of the 1,689 applications are from Native Americans. San Juan County also has a significant percentage at 18.53%, with 15,179 applications in total.
Arizona is home to the other two counties in the top five. Apache County has a Native American applicant percentage of 18.28% out of 5,043 applications, while La Paz County has 5.95% out of 2,251 applications.
To understand where Native Americans are applying for loans in Arizona and New Mexico, we analyzed mortgage loan applications from 2018 to 2021. By studying almost 2.6 million records, we identified those applications involving Native American applicants.
Figure 4
Out of all the records, we found only 47,790 loans with a Native American applicant, making up 1.9% of the total applications. Despite having over 1.7 million applications, Phoenix saw only 1.3% of them coming from Native Americans. However, this still made Phoenix the home to over 22,000 Native loan applicants, the most in the study area.
Figure 5
When discussing lending to Native Americans, particularly on tribal land, the importance of manufactured housing comes into focus. A striking 7.9% of Native American homebuyers from 2018 through 2021 opted for financing a manufactured home, more than double the national average.
We divided our analysis between two main categories: site-built homes and manufactured homes. It’s essential to realize that these two types of housing drive many of the differences we observe in the mortgage market.
As we noted in our report on 2021 mortgage lending, while federal datasets capture 88% of the overall US mortgage market, the manufactured home market is covered less thoroughly. Many firms that lend for manufactured home purchases are not required to report data under the Home Mortgage Disclosure Act (HMDA) due to various financial and regulatory rules. However, as the Minneapolis Fed noted in their report on the use of HMDA to assess lending on tribal lands, “despite significant coverage gaps in some areas, HMDA is a useful and important source of information about rural home lending, including for most of the American Indian reservations in rural areas.”[14]
The differences in lending become apparent when looking at statistics such as the origination rate. On tribal land, applications to buy a manufactured home were three times higher than those for site-built homes. In areas without tribal land, site-built home applications outnumber manufactured housing by 15 to 1.
Figure 6
In the tribal land home loan market, there are discernible differences between lenders for site-built homes and manufactured homes. Among the top lenders for site-built homes, we find mortgage companies such as Rocket Mortgage, the largest lender in the country, which leads with 168 loans, and Nova Financial with 107 loans. Banks and their affiliates also have a presence in this sector, with BOK Financial and Waterstone making 57 and 48 loans, respectively. The site-built home market exhibits a competitive landscape, with the top lenders closely matched in terms of loan volume.
The manufactured home market is characterized by a significant disparity in loan volumes among the top lenders. The dominant lenders in this market – Vanderbilt Mortgage (272 loans) and 21ST Mortgage (132 loans) – are both owned by Clayton Homes, which is in turn owned by Warren Buffett’s financial titan Berkshire Hathaway. Buffett and his lieutenants are therefore the prime mover behind the manufactured home lending that defines the mortgage market in our study area. Other mortgage companies in the dataset hold a vanishingly small portfolio by comparison, with three firms – Mid America, Del Norte Credit Union and Waterstone – furnishing a combined 44 such mortgages.
Berkshire Hathaway therefore holds about 90% of the manufactured home mortgage market in our study area. It is possible that this monopoly owes to some set of specialized lending practices or niche marketing strategies. But whatever has fostered Buffett’s mobile home monopoly, basic economics dictates that his near-absolute hold on Native American home lending is a key driver of the higher costs those borrowers incur.
Curiously, the lender with the largest market share of HUD 184 Loans (a loan product specifically for Native Americans and with a 100% guarantee to the lender against loss in the case of default) is Mid-America Bank[15]. Up until 2015 Wells Fargo was one of the leading 184 lenders however, they disbanded their residential lending team and as of 2023 they are no longer an approved lender. In fact, none of the big three banks (Wells Fargo, Bank of America and Chase) are approved lenders offering Section 184 mortgages.
Figure 7
In areas with no tribal land, traditional site-built homes are the overwhelming preference, comprising nearly 96% of homes. Manufactured homes, often more affordable, make up just a tiny fraction. However, as we move into areas with more tribal land, manufactured homes become more common.
In places where tribal land makes up less than half of the area, about 17% of homes are manufactured. This number jumps to over 33% in areas where tribal land constitutes more than half of the land. The trend continues until we reach pure tribal land, where the balance between manufactured and site-built homes is nearly even, with 49% manufactured and 51% site-built.
This pattern reveals a distinct shift in housing choices as the presence of tribal land increases. On tribal land, the near-equal distribution between manufactured and traditional site-built homes may reflect a unique blend of housing that caters to the specific needs, preferences and economic conditions of the communities.
Figure 8
In census tracts with no tribal land, about 80% of home purchase loans are for manufactured homes with land, while almost 20% are for manufactured homes without land. This trend is almost mirrored in tracts with less than 50% tribal land, where the figures are 80% and 20%, respectively.
As we move to areas where tribal land is more prevalent, the trend shifts. In tracts with More Than 50% Tribal land, the proportion of loans for manufactured homes with land drops below 70%, while loans for manufactured homes without land increase to 31%.
The most significant difference is observed in the “Tribal Land” category. Here, only 16.24% of loans are for manufactured homes with land, while a substantial majority of 83.76% are for manufactured homes without land.
Figure 9
Regarding land property interests, different patterns emerge based on the presence of tribal land. In areas without tribal land, most people own their property directly, making up over 84% of the total. Some have paid or unpaid leasehold agreements, but these are relatively rare.
On and near tribal lands, the picture changes. In areas where less than half the land is tribal, direct ownership is still the most common, but unpaid leasehold agreements begin to rise. When more than half the land is tribal, direct ownership drops noticeably and unpaid leasehold agreements jump to over 21%.
The most dramatic shift happens on tribal land itself. Here, direct ownership falls to less than 30% and unpaid leasehold agreements become the most common form of property interest, accounting for over 56%. Paid leasehold agreements also increase, while indirect ownership remains minimal.
Lacking the ability to borrow against the land means that American Indian homebuyers both pay higher interest but cannot build equity. However, land trusts are an established if not novel tool used both to preserve open space in rural areas, and provide affordable homeownership opportunities in urban areas. And yet mortgage lending on tribal trust land as compared to community land trusts has a vastly different cost for Native homebuyers.
Might the lack of land ownership on tribal trust lands combined with the nascent mortgage market on tribal lands be driving up the cost of loans on the sale of manufactured homes on tribal trust lands? Not only are chattel loans generally ineligible for sale to the secondary market, but manufactured homes lose value over time when compared to site built homes. Might lenders’ reluctance to offer mortgages on tribal trust lands owe to a combination of inaccessibility of the secondary market and inefficient exit strategies? Currently, lenders making loans for manufactured homes without a permanent foundation must hold loans in portfolio thus limiting their liquidity. Moreover, in the case of default they are unable to liquidate both the land and manufactured home and must route their attempts to be made whole through the complexities of dual tribal-Federal oversight. Might such lenders rely on higher interest rates on such loans to maintain their margins even when using a 100% guaranteed loan product? Though the question cannot be definitively answered without access to the financial models of manufactured housing lenders, we must nonetheless ask why these lenders charge so much more for such loans.
Figure 10
When analyzing mortgage loans, one of the essential measures is the rate spread, defined in basis points. A basis point is a hundredth of a percentage point (0.01%). The rate spread is the difference between the interest rate at closing and the Average Percent Offer Rate (APOR). This difference tells us how much more or less a borrower is paying for their loan compared to the average on a given day.
From 2018 to 2021, the analysis of mortgage loans across the study area revealed a concerning trend. Native American borrowers, both on tribal lands and in general, tend to pay more for their loans than their non-Native counterparts. This higher cost is evident in the rate spread, where Native American borrowers are charged a higher number of basis points.
There are multiple reasons for this disparity. Smaller loan amounts often lead to higher interest rates, and many Native American borrowers rely on manufactured housing, which can also increase costs. Additionally, there is a lack of lenders operating in these areas, reducing competition and potentially driving up prices.
The difference in loan costs is even more pronounced in the manufactured home loan space. Here, Native American borrowers pay a rate spread almost three times as much as that paid by non-Natives. Manufactured housing is more common in tribal areas, and the loans associated with this type of housing are often subject to higher interest rates.
Figure 11
For site-built homes, borrowers’ income on tribal land is lower, at an average of $84,282, compared to areas with More Than 50% Tribal, where it’s $122,818. This trend continues with the loan amount, where Tribal Land has a lower figure of $214,924, compared to $303,977 in areas with Less Than 50% Tribal. The property value follows suit, with Tribal Land at $263,711, less than the $344,102 for No Tribal Land. Interestingly, the loan-to-value ratio, which shows how much of the property’s value is being borrowed, is quite similar between Tribal Land at 81.5% and No Tribal Land at 81.99%.
When it comes to manufactured homes, the differences are more pronounced. Tribal Land has a much lower average borrower income of $60,333, compared to $205,847 for No Tribal Land. Similarly, the loan amount for Tribal Land is less, at $95,522, compared to $130,615 for No Tribal Land. Tribal Land’s property value is also lower, at $103,484, while No Tribal Land’s value is $153,726. However, the loan-to-value ratio for Tribal Land is higher at 92.31%, indicating that a larger portion of the property’s value is being borrowed, compared to 84.97% for No Tribal Land. This is most likely a function of the generous terms of the HUD 184 Loan Guarantee Program.
Berkshire Hathaway, Fannie Mae and Freddie Mac
The Center for Indian Country Development (CICD) at the Minneapolis Federal Reserve found unequal lending practices for Native Americans, with higher interest rates on and off tribal lands. While off-tribal disparities could be linked to lower credit scores, the disparities on Tribal Land were due to reliance on home-only lending, where the land isn’t included in the loan.
Fannie Mae and Freddie Mac, organizations that buy mortgages and sell them again, are crucial in this dynamic. Though the Housing and Economic Recovery Act of 2008 requires them to support manufactured housing, about 80% of such loans are ineligible for purchase by them. Even with eligible loans like FHA loans, they charge extra interest for risk, despite government insurance meant to mitigate that risk. This leaves few lenders willing to serve this market.
In this gap, Berkshire Hathaway has become dominant in manufactured home loans, especially on tribal land. Their subsidiaries, Vanderbilt Mortgage and 21st Mortgage, account for almost 8% of all manufactured home lending and 15% of purchase loans in Arizona and New Mexico as a whole, but 74% and 85% on tribal lands in those states. They target lower-income borrowers, with an average income of $62,000, average loans of $94,403 on homes worth $105,756 and a loan-to-value ratio of almost 90%, compared to other lenders’ 83%.
Berkshire’s fees are also higher. From 2018 to 2021 in Arizona and New Mexico, half of the homebuyers on tribal land were purchasing manufactured homes, with 84% of these loans made by Berkshire. While others reported an average interest rate of 4.33%, Berkshire’s was 8.56%. The rate spread illustrates this contrast further, with Berkshire charging 537 basis points compared to other lenders’ 140.
Additionally, Berkshire’s closing costs are higher, with an average origination fee of $3,799 for manufactured home buyers, while others charged $1,751. This deviation, especially their high fees and interest rates on or near tribal lands, indicates more predatory practices, leading to higher costs for borrowers.
Small Business Lending
The latest census data capture the extent of small business operations by Native Americans. While there are many AIAN-owned small businesses nationally, most of these are non-employer businesses with a self-employed owner. The data on Native American owned small businesses has shifted considerably with the new census, which offered respondents new demographic responses and found staggering jumps in counting statistics related to Native American identity as a result. For their 2020 survey, the Census Annual Business Survey (ABS) reported 40,392 American Indian Alaskan Native (AIAN) owned employer firms in the US – a more than 50% single-year increase, likely owing to the changes in census category labels.
Arizona has 899 AIAN-owned firms registered. Equivalent data for New Mexico is unavailable. Nationally, Native American-owned small businesses employ nearly a quarter-million people, generating $9.5 billion in payroll in 2020 (Figue 12). While these numbers may seem substantial considering the history of underdevelopment of tribal areas, AIAN business ownership is lower than that of other demographic groups, except African Americans. In 2020 only 0.69% of employer businesses were AIAN owned compared to 6.05% for Hispanics and 10.5% for Asians. Major industries with AIAN ownership include construction, professional, technical and scientific services, accommodations and food services, retail trade and health care.
Figure 12
The lack of economic development of tribal areas is evident in an assessment of the income level of residents living there. Tracts in Arizona and New Mexico containing tribal land have the highest concentration of low- and moderate-income (LMI) households in both states. The LMI designation refers to federal guidelines defining the level of median income for census tracts below 80% of the median income level of the surrounding metropolitan area or state in which the tract is located. Three-quarters of the tracts with high proportions of tribal land are LMI, while less than a quarter with no or low proportions of tribal land are LMI (Figure 13). The lack of economic development is also evident in how businesses are distributed (Figure 13). Businesses are overwhelmingly located – more than 97%, on non-tribal lands in the two states, with mostly or all tribal land having a little over 1% of businesses. The proportion of small businesses in LMI census tracts of tribal areas reflects the preponderance of LMI areas there.
Figure 13
Despite tribal areas having a higher number of businesses in LMI rather than middle- to upper-income (MUI) tracts, the number of small business loans made are a fraction of the loans made in LMI areas with little or no tribal land. Over the span of four years, an average of only 5 loans were made for each LMI tract in tribal areas, contrasted with an average of 82 loans per tract in LMI non-tribal areas. While small business lending improves in MUI tracts of tribal areas, it is considerably less than the levels of lending on non-tribal land – an average of about 31 loans compared to nearly 100.
Figure 14
Overall, tribal areas are mostly LMI. They have fewer small businesses and receive a fraction of the small business loans that other areas receive. Figure 15 shows total small business lending for Arizona and New Mexico. Areas comprised entirely of tribal lands received 0.004% and 0.012% of the dollar amount of small business loans made from 2018-2021 in Arizona and New Mexico respectively. This severe deficit in access to capital reflects the underdevelopment of businesses on tribal lands.
Testimonials collected for this report indicate a high level of informal economic activity not captured by census or other publicly available data. Native Americans we spoke with emphasized the importance of mutual support of extended family and others in the community in the face of a harsh economic landscape.
Today’s informal community economic activity may involve crowdfunding to start a business or weather a financial emergency, but these digital age expressions of solidarity and self-sufficiency reflect the same ethos as the group work of traditional tribal economies as well as the barn-raising practiced by European colonists as they moved west from the Atlantic coast. Informal economic practices also show up in the Indigenous response to homelessness: Tribal areas report relatively low incidence of homelessness in formal surveys, but in part because neighbors and family members often prefer living in an overcrowded home to letting their loved ones suffer outdoors.
In all cases, this informal economic order is not by choice – It is a direct outcome of underinvestment in tribal communities. Like the HUD Section 184 loan guarantee program, the Bureau of Indian Affairs offers business loan guarantees of up to 90%, yet few banks have sought to secure preferred lender status under the program and fewer still use the guarantee to solicit business from Native American entrepreneurs.
Figure 15
Pandemic related lending programs
The hardships imposed from the spring of 2020 onward by the COVID-19 pandemic were particularly hard felt in tribal areas – especially on the Navajo Nation.[16] A combination of higher risk factors from asthma, diabetes and obesity, combined with the structural factors of a lack of infrastructure, resulted in higher rates of morbidity and mortality in tribal areas of Arizona and New Mexico.[17] Reliable data on the economic impacts of the pandemic in Arizona and New Mexico is difficult to find. However, data on Paycheck Protection Program (PPP) lending from 2020-2022 provides some insight into which industries benefited from access to these grants (Figure 16). The data indicates that key economic, governmental, and services received support that was crucial to maintaining their operations as a result of the PPP. Casinos – a major source of revenue and employment on tribal lands – received over $22 million in PPP loans, supporting 2,300 workers during the pandemic. $15 million went to restaurants, supporting another 2,500 jobs. Corporations involved in electrical power were next, receiving $11 million in support while employing about 500 people. Hotels got about $9 million in support of roughly 1,100 workers. Tribal governments employing 615 persons received $6.8 million.
Figure 16
The data above suggests that PPP lending to employer businesses provided crucial economic support during the national health crisis. Tribal lands represent 3.8% of the tracts in Arizona and New Mexico and received 5% of the PPP loans in those states. Such loans totalled $128 million, with a high average loan amount of $208,000. This contrasts with tracts with no tribal land, which received 10,034 loans totalling $921 million for an average of nearly $92,000. The relatively high average loan amount is because of the large amount of PPP lending made to casino hotels and casinos, many of which are located on tribal land (Figure 17). Additionally, little of the PPP lending in tribal areas was conducted through the fintech firms that have since been accused of defrauding the program, indicating that the funds were properly disbursed and used under government program guidelines.
Figure 17
Financial Needs Index & Access to Banking Services
Tribal areas in Arizona and New Mexico almost always receive an FNI rating of “Very High,” while other rural areas in these states can have FNI scores ranging from Very High to Low.
Figure 18 and 19 illustrate that tribal areas in these states generally have greater financial needs than the non-tribal areas around them. This includes rural places that are not part of tribal lands.
There are far fewer bank branches and credit unions available to those living within tribal lands. The distances between branches are bigger there compared to non-tribal areas. One map below displays these higher levels of need within tribal lands with existing bank branches while the other shows the same with existing credit unions.
The combination of their remote location, lower population density and limited access to mobile banking contributes to the high levels of financial need in tribal areas within Arizona and New Mexico.
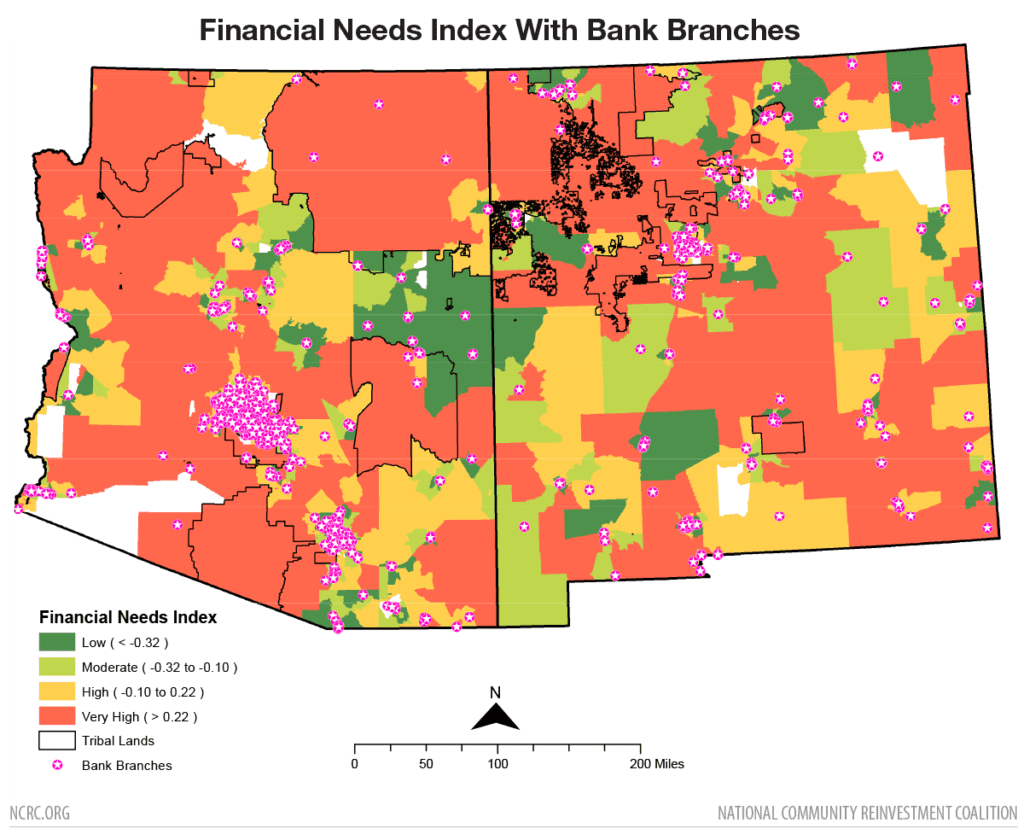
Figure 18: Financial Needs Index for the states of Arizona and New Mexico with tribal areas outlined and existing bank branches. Source: 2017-2021 ACS 5-year estimates, 2022 FDIC Summary of Deposits.
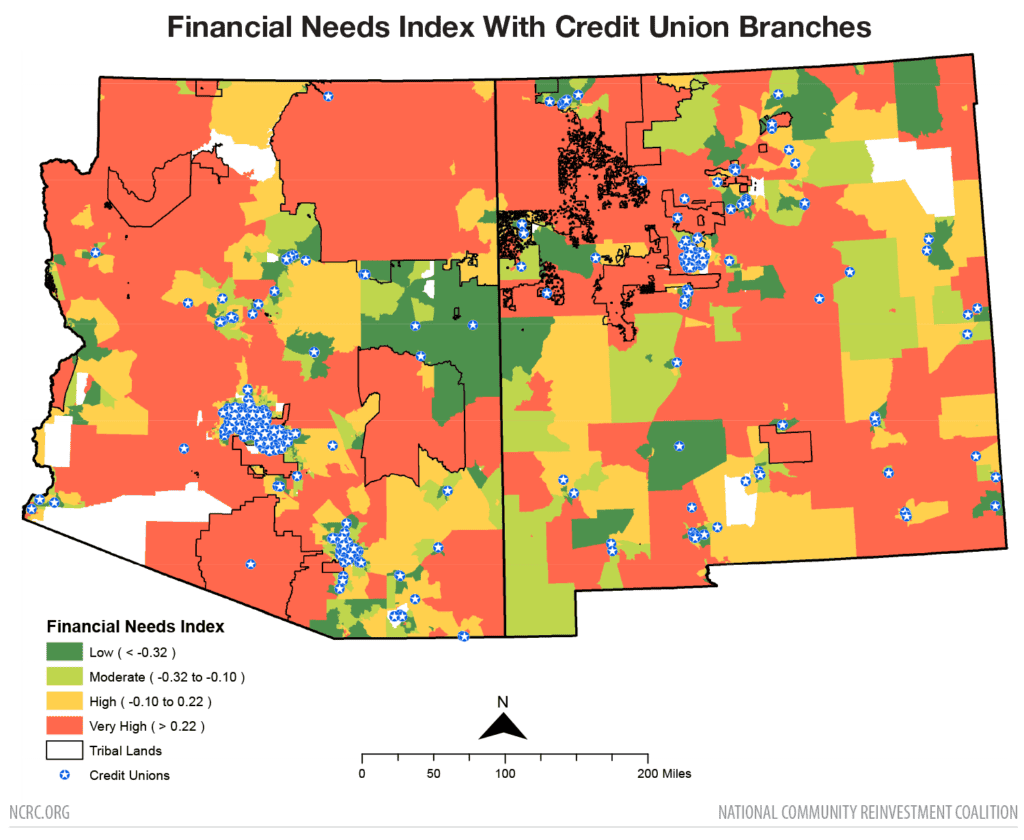
Figure 19: Financial Needs Index for the states of Arizona and New Mexico with tribal areas outlined with existing credit unions. Source: 2017-2021 ACS 5-year estimates, NCUA 2022 Call Report.
Predatory lending and alternative financial access
Predatory lending practices can impact any vulnerable community that lacks access to mainstream financial services. Predatory lending is characterized by unsuitable loans that exploit vulnerable and financially under-educated and underserved people and communities.[18] These predatory lending practices manifest in several ways: high-interest loans with exorbitant fees; payday, pawnshop and title loans; and online lending with deceptive terms.
Several factors now familiar from other sections of this report leave Native Americans living in tribal areas more susceptible to these exploitative practices. Geographic remoteness and the absence of competing services presents consumers with a lack of freedom of choice in the market.[19] The lower rates of financial literacy and higher percentages of unbanked households in tribal areas increases their vulnerability to predators. Additionally, some predatory lenders have exploited tribal sovereignty to sidestep state regulation by formally locating their business on tribal land. Consequently, borrowers in tribal areas may not be as fully informed of the terms and conditions of loans as other people in areas of the state that are more strictly regulated.
Conclusion
The only red lines that should exist in Indian Country are those naturally formed by the mesas, along the waterways and landscapes of the red earth that defines much of tribal land in the Southwest United States. Instead, the practice of redlining tribal communities by financial institutions continues despite the Community Reinvestment Act of 1977 which sought to prohibit such practices.
The banking community has been trying to have it both ways on these issues. In public, industry leaders bemoan the lack of data related to tribal community economics and argue these blindspots are the problem. In private, they lobby to keep us blind by urging lawmakers, regulators and courts to dismantle or at least delay regulations requiring banks to track and report their lending activity on tribal lands. Fortunately, the current federal administration saw fit to require CRA reporting tied to Tribal Land Areas in its recent overhaul of the law’s implementing regulations.
There is no doubt that tribal governments have work to do to ensure Indian Country is a more business friendly environment. But federal lawmakers and private capital need to furnish resources that Native-led institutions can wield more effectively. Key tribal leaders have for decades described this notion using a resonant analogy from US and European history: After World War II the victors were determined to bring European economies back online, not only restored but stronger and more resilient. They did so at their own expense, calling those massive investments the Marshall Plan. The opposite was true for tribal nations after the Indian Wars. US leaders did not want tribal nations to be either stronger or more resilient. Indian Country never got its Marshall Plan. The legacy of that failure continues for Native America more than a century after colonial conquest.
Despite that history, American Indians are distinguished as having the highest proportional participation in the armed forces. American Indians played a major part in winning WWII through use of Native languages to create a code the Axis powers never broke. The innovation and patriotism these communities have shown to a government that brutalized them has not been rewarded. Native Americans today rank last among US demographic groups in assessments of social determinants to health and economic well-being. The research represented in this report is one part of a much larger effort to reverse these trends.
This data and analysis are limited to tribal areas in Arizona and New Mexico. Amplification of the relevant issues could be made more relevant with support for the replication of this analysis for other regions across Indian Country. In doing so, partners and allies in the financial services industry, the public sector and philanthropy will better understand the local dynamics of tribal economies necessary to inform well-crafted, community based solutions.
The physical beauty of tribal landscapes should be matched by the economic vibrancy of tribal communities. Readers of this paper, particularly those who are financial industry practitioners in both the private and public sectors, can help realize that vision by both utilizing significant reforms under CRA and crafting new business practices to address the crisis we depict in this work.
Appendix A: Literature Review
Many of the issues discussed in the literature on financial access reflect two basic differences between tribal areas versus other areas of the United States: property rights and local governance. Property rights in tribal areas are complicated by the history of how land was allocated when tribal areas were established, and by the structures that have come into being to administer the land.[20] [21] [22] The Native worldview produced traditional practices of land and resource management which are strictly adhered to and still practiced today, for example by Hopi and Pueblo tribes. These practices challenge the assumptions of private property rights and commodification of land that operate by default elsewhere. As a consequence of this history, tribal areas are uniquely complex in their systems of land ownership and administration (Figure 21). There are several different mechanisms of ownership, and most do not correspond with the clear system of private property rights in non-Native lands.[23]
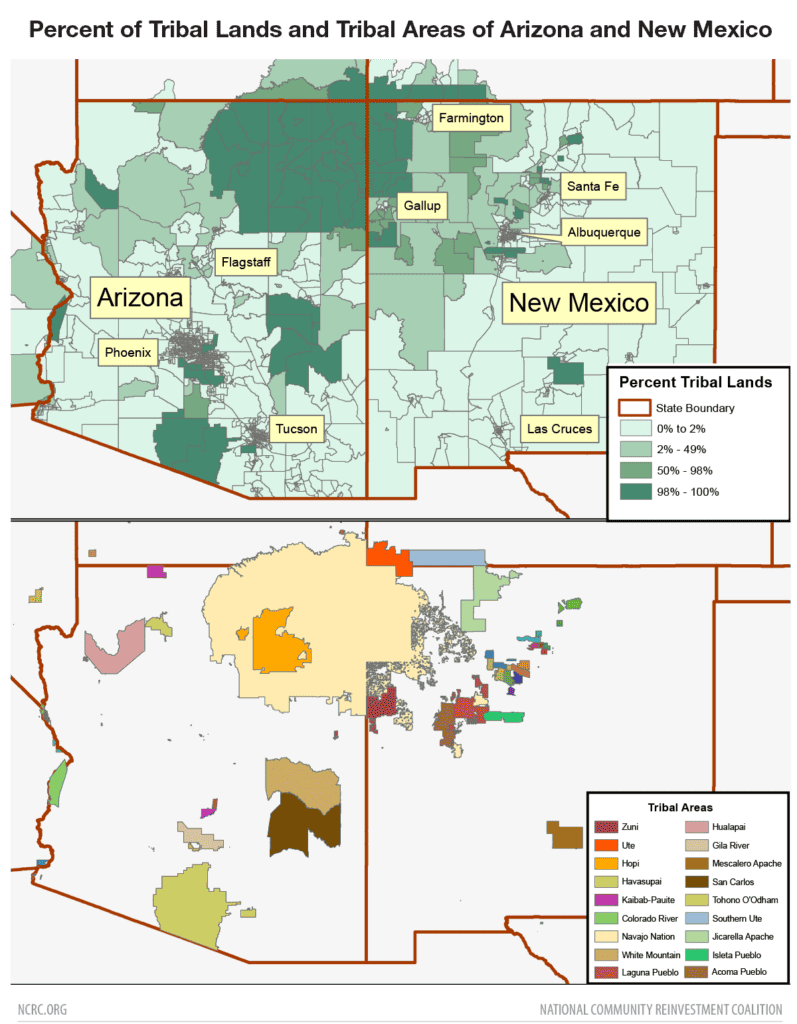
Figure 20: Major tribal areas and percent tribal lands in Arizona and New Mexico.
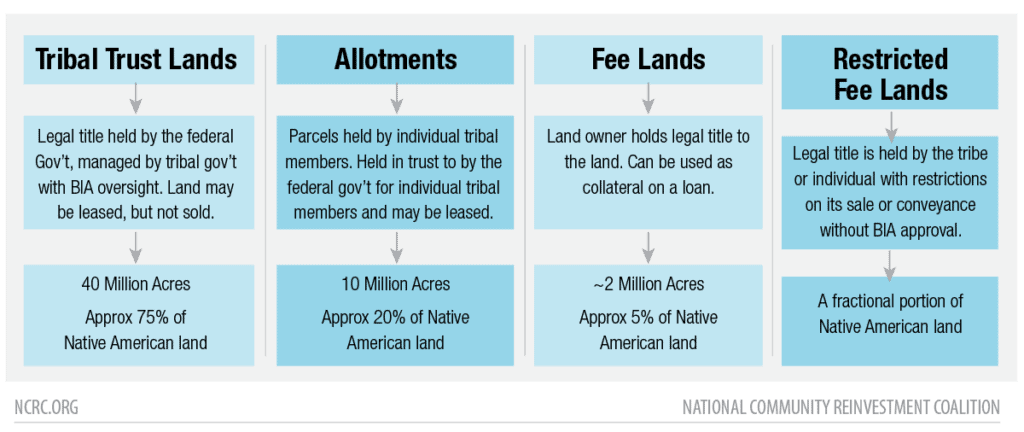
Figure 21: Source: Federal Reserve Bank of Minneapolis: https://www.minneapolisfed.org/indiancountry/resources/tribal-leaders-handbook-on-homeownership/navigating-land-issues
About 75% of Native American land is managed as tribal trust land, meaning that the federal government holds title but individual tribal governments administer it. Since the title is held in trust by the federal government, the land cannot be sold without its approval, but may be leased through a process involving federal and tribal authorization. Leasing arrangements are managed by tribal governments, with oversight by the Bureau of Indian Affairs (BIA) – except in those cases where tribes have assumed primary authority over such processes. The special status of tribal land impacts both homeownership and entrepreneurship in tribal areas by frustrating commercial interests to collateralize tribal land for credit purposes. Collateralization – or the ability to use the value of property in order to secure credit for its purchase by borrowers – underpins the mortgage finance system, based in English canon law and the de facto standards of the dominant society surrounding tribal lands. Because Native peoples do not own their lands and cannot use it as collateral, they must use more innovative arrangements for securing credit. An example of an alternative arrangement actively in use is to secure the loan against a lease on the property, but this also makes it necessary to engage tribal governments and the BIA in the credit-making process.[24] Consequently, a dual layer of administration – tribal and federal – is involved in most decisions regarding land use in tribal trust lands. These complications act as constraining factors in the areas of mortgage lending, small business lending and small farm financing.
This deliberately complex system has its benefits, primarily as a cumbersome but largely effective safeguard against further loss of tribal lands. After all, the Federal government remains a trustee over tribal lands. And despite a contemporary effort to advance tribal self-determination,[25] acts of warfare and domination against American Indians have left a legacy of social and economic distress. Beyond the social determinants of negative health outcomes touched upon in the introduction, other factors such as thin or blemished credit histories,[26] [27] [28] [29] the isolation and rurality of tribal areas,[30] [31] [32] and the scarcity of bank branches[33] [34] [35] also restrict financial access.
Mortgage Lending
Between 1991 and 1996, only 91 conventional mortgage loans were made to Native American borrowers living on tribal lands.[36] No place on the planet where fewer than 20 families are able to buy a new home each year can be seen as economically functional. This is a striking abject failure.
The Native American housing crisis is a matter of supply, not demand. Despite the enormous obstacles to Native Americans obtaining mortgages on tribal land, demand for housing is considerable. First, the Native American population seems to be growing. In 2000, 4.1 million people identified as Native American. This grew to 5.2 million in 2010 and jumped to 9.7 million in 2020 – a near-doubling in one decade that is almost certainly driven by changes to Census questions and corresponding shifts in responses from people whose practical connection to life in tribal areas likely varies a great deal.
Estimates vary, but in 2018, about 60% of Native Americans lived on or close to tribal lands.[37] Population growth may be a factor in increasing demand for housing, but it is unlikely that the Census counts reflect true growth in the number of human beings directly affected by the issues studied here. Historically there have been problems with the Census’ attempts to count Native Americans.[38] Changes in how the 2020 Census asked about race and ethnicity have created substantial increases in the number of people identifying themselves as non-White or multi-racial. With that caveat, the share of people in our study area identifying as Native American spiked in the 2020 data – from 4.6% to 6.3% in Arizona, and from 9.4% to 12.4% in New Mexico.
Whatever the reality of population growth among Native communities, such data are not as keen a lens into housing needs in tribal areas as they are in urban ones. A better indicator for Indian Country may be the long-standing housing disparities on tribal lands and the historic lack of available resources to address the disparities.
Overall, rates of homeownership are much lower for Native Americans than they are for non-Hispanic White households. Homeownership estimates for Native Americans vary widely: Census ACS 5-year data for 2019 places the AIAN homeownership rate at 56.7%,[39] while 2017 Census data from the Housing Vacancy Survey has 50.8%[40] of Native Americans owning their home. This is in contrast with estimates of between 71.7%[41] and 73.7%[42] homeownership rate for non-Hispanic White households in 2019. The different levels of homeownership between non-Hispanic White households and Native Americans vary widely state to state. In New Mexico there is a gap of around 10%, while in Arizona the gap is over 16% (Census ACS 5-year 2016-2020). There is also community demand for homeownership among Native Americans living in tribal areas, with 75% reporting a strong desire to own their own home[43]. This demand for housing is driven by several factors including shortages of new housing, the obsolete or deteriorated condition of existing housing stock, overcrowding and homelessness.[44] In the Navajo Nation, many homes lack basic amenities such as plumbing, adequate heating and insulation.[45] Figure X outlines present housing characteristics in the counties within Navajo lands of Arizona and New Mexico, revealing that modern plumbing is rare, wood is the primary heating fuel and many families live in mobile homes. Rents, however, are more affordable than the state average in most tribal areas, save for Coconino County in Arizona.
Figure 22
This data aligns with deficiencies that are prevalent in Native American homes at the national level. Native American homes are six times as likely as the national average to have plumbing issues (6% vs. 1%) and substandard heating (12% vs. 2%). Such disparities are even wider when it comes to overcrowding: 16% of Native American households are overcrowded, eight times the national average of 2%.[46] Overcrowding is directly linked to homelessness: Rather than sleeping in the street, many people in tribal areas live with friends or relatives because they have no place of their own. These factors point to substantial unmet demand for affordable housing on tribal lands.
Scared Money
Solving this broken marketplace is a complex challenge given the tribal land ownership structures that make the standard collateralization process difficult or impossible. On its face, bank and lender behavior appears logical enough. The specific reality of governance structures and property rights on tribal lands would frighten a reasonable lender who is accustomed to dealing with a very different landscape elsewhere. Because land is not individually owned, the ability to foreclose on the property in case of non-payment is constrained and lenders correspondingly withdraw.[47]
Market reaction to these property rights issues is further compounded by the unfamiliar governance structures which operate on tribal lands. Traditional lenders are further spooked by the sovereign status of tribal nations, which places authority in tribal courts rather than the state and local judiciaries to which lenders are accustomed. The interplay of federal and tribal governance complicates administrative processes.
This resulted in a situation where the demand for housing by Native Americans, especially those living on tribal land, has not been met successfully by the mortgage lending system.
But while lender behavior may appear sensible in the abstract, the federal government has already taken clear and powerful steps to give capital confidence. The private sector just hasn’t bothered to make use of that specialized system.[48] Worse yet, there has been no consequence for lender recalcitrance. Congress has done a part of the work necessary. If banks do not use the tools offered then regulators must wield the tools they hold to advance economic justice.
Mortgage Lenders Already Face No Risk Of Loss
Three decades ago, HUD developed the Section 184 Indian Home Loan Guarantee program[49] to increase access to capital for home purchase lending in tribal areas. Initiated in 1992, HUD’s Section 184 program makes home loans to Native American borrowers that are guaranteed 100% in case of foreclosure. This eliminates the risk to mortgage lenders in the event of the Native American borrower’s foreclosure and is available for single-family housing of one to four units located on tribal trust, individual allotted, or fee-simple land. In order to participate in the program, tribes must enact provisions for leasing, eviction, foreclosure and other legal procedures through their tribal courts. Tribal governments can then apply for approval as part of the eligible areas (EAs) for the Section 184 program. Lending volumes under the Section 184 program are in Table 1. Over the history of this program, a majority of the loans have been made to fee-simple properties, in which clear title of land ownership enables the property to be collateralized. But even in that leading category, just 2,160 mortgages were made through Section 184 over its first 12 years, with very few loans being made on tribal trust land. Changes to the program, including expansion of eligible areas for lending, greatly increased lending to fee-simple properties. But lending increases in tribal areas were only modest. The peak year of performance of the program in 2016 saw 4,345 loans made to fee-simple properties, with tribal areas receiving only a tenth of that number.
Figure 23
While the Section 184 loans may seem like a solution to the complexities of land ownership and tenure, the impact of the program has been low on tribal trust lands. Even after Section 184 was initiated, complications persisted with the extreme difficulty in lending on tribal trust lands.[50] A 2001 CDFI Fund survey reported that 65% of respondents found it “impossible” or “difficult” to obtain mortgages on tribal land.[51] Two early studies found minimal impact of this program, with no statistically significant improvement in lending outcomes.[52] [53] These dismal results spurred action to revise the administration of Section 184 and involve tribal governments more directly in solutions, leading to an increase in the number of EAs. A more recent analysis of the program indicated that there has been a sizable increase in Section 184 mortgage lending since 2004.[54] By 2015, a total of 28,540 loans had been made under the program – just 2,200 per year on average. Fee-simple properties still dominated, accounting for 92.5% of the total, while only 5.9% of those scarce loans were made on tribal trust lands and the remaining 1.6% were on allotted land. In dollars, this amounted to $4.3 billion in loans under fee-simple land arrangements, $340 million for tribal trust lands and $84 million on allotted lands. This meant that the highest volume of Section 184 loans – 13,095 in total – were made in Oklahoma, where fee-simple land arrangements are most common. Arizona and New Mexico, meanwhile, received the highest number of loans on tribal trust lands at 1,015.
While there has been an increase in mortgage lending on tribal lands, particularly where fee-simple land arrangements exist, the high cost of the loans being made means that Native Americans pay significantly more than other Americans for credit access.[55] There are several reasons for this: Section 184 loans involve higher origination costs, the loans are often made to purchase manufactured housing and a higher percentage of Native American loan applicants have thin or blemished credit histories.[56] In 2016, 30% of the mortgage loans to Native Americas living in tribal areas were considered higher priced, compared to 10% overall. High priced loans are those that carry an interest rate that is 150 basis points higher than the average percent offer rate (APOR) on the day of closing. This is referred to as the rate spread. Higher rate spreads for Native American borrowers result in higher interest rates for those borrowers overall, and make long-term wealth-building slower or even impossible. Loans to Native Americans reported an average interest rate of 5% compared to 2.5% for non-Native Americans. This translates to $107,000 in additional costs over the life of a 30-year mortgage. Native Americans are not only getting less house and worse house for the dollar, as established above – they’re also getting charged six figures more for the privilege. A recent report by the Federal Reserve Bank of Minneapolis confirms that nationally, there are significant differences in the rate spreads and interest rate disparities between Native American and White borrowers, and that they are especially acute for Native Americans living on tribal lands.[57]
A prevalence of manufactured housing also impacts the higher cost of lending and limits the ability of Native Americans to generate equity.[58] In 2018, about 17% of Native American households lived in manufactured housing or recreational vehicles. From 2018 to 2021 just over 7% of all Native Americans that obtained a home purchase loan used it to buy a manufactured home.[59] On tribal lands, however, this rate rises to 39%.[60] That’s almost 14 times the national 2.9% share of borrowing that’s used to buy a manufactured home. There are several reasons for this: Most tribal lands are rural with limited infrastructure. Consequently, home sites may not support electricity, sewer and water access. There are also the issues of land tenure and leaseholding arrangements, plus manufactured homes may not involve as much initial expense to purchase and site.[61] Because manufactured homes are considered chattel property, like automobiles and boats, interest rates are substantially higher – often 50 to 500 basis points higher than on real property. This translates into interest rates higher than 15%.[62] In addition, manufactured housing does not appreciate in value the way that site-built housing does. Native American borrowers are being charged a higher price to buy something that will be worth less and less the longer they live in it.[63]
While important, wealth-building is of course only one facet of the value of getting a home. The intensity of overcrowding and homelessness already discussed above play a role too. Manufactured housing can still be the best option in rural areas lacking infrastructure,[64] partly because they require fewer steps to purchase and site. Additionally, initial costs are lower, requiring less capital outlay for the household to gain shelter. Nevertheless, we must ask if this option of last resort is fair and reasonable – particularly when banks have effectively chosen to invest their resources that are 100% guaranteed against loss away from tribal trust lands where they are clearly needed most.
Impact on Entrepreneurship
Studies of indigenous entrepreneurship are few, fragmentary and difficult to generalize because of their specific focus on tribal nations and concentration in limited geographies living in very different economic circumstances.[65] [66] Difficulties in economic integration coupled with inadequate access to the social and material resources to encourage small business formation and expansion are recurring themes in the literature. Another theme involves Native American approaches of rejecting and resisting economic engagement – “opting out” or “opting in” to actively transform conditions within tribes’ local territories through entrepreneurial activities that reflect the culture, values and beliefs of the tribe.[67] Business ventures can be used as a way to “secure community sovereignty, rights and access to the social, environmental and economic resources required for actualizing and revitalizing tribal traditions, culture, values and social economies” so they can thrive in the future.[68] However, access to capital, inadequate infrastructure, regulatory and legal complexity, market access and minimal business development and support services have been significant hurdles for Native American entrepreneurs.[69] While many of the same issues are faced by rural businesses generally, several are specific to Native American small businesses and are complicated by the regulatory and jurisdictional issues discussed earlier. Additionally, a history of exploitation by predatory businesses and institutions has resulted in a distrust of non-Native financing resources for businesses, leaving some Native American entrepreneurs reluctant to engage with conventional lending sources like banks.[70]
One study of Native American owned businesses in Wisconsin found that limiting factors included their geographic remoteness, reduced access to business networks, lack of owner business knowledge, the difficulty in attracting employees with higher levels of education and limited access to capital.[71] Business owners reported that conventional financing through banks is impeded by several factors: lack of credit history, limited collateral and difficulty accessing banks because of rural location and isolation. Earlier research found similar problems with capital access in their study of Native American credit access.[72] The issues of inadequate or blemished credit histories and limited collateral combine to make the purchase of equipment and hiring of staff key limitations on business startup and expansion. Despite these problems, once in operation there is some evidence that AIAN small businesses have higher rates of survival than those of non-AIAN establishments located in comparable counties – particularly for businesses in the arts and entertainment, wholesale and retail, education and public administration industries.[73]
The geographic remoteness of tribal areas impacts the success of businesses by limiting or raising barriers to market access. First, poor internet access impacts marketing to broader geographies. As of 2021, internet access to households in tribal areas remained lower, slower and more expensive: 21% fewer households had an internet connection in tribal areas than in adjacent non-tribal ones, and their connections were 11% more expensive and 75% slower.[74] This hampers the ability of Native American businesses to connect and transact with broader national and international markets through e-commerce activities. Second, transportation access in tribal areas is poor. Inadequate roadways, limited public transportation and lack of air transportation access impedes the flow of people and goods, hobbling business development. As of 2022, there were 157,000 miles of roads crossing the 55 million acres of tribal areas – and little of that mileage was suitable to modern commercial transportation methods. 70% of BIA roads and 75% of tribal roads are unpaved.[75] The general condition of roads has been a persistent problem: As of 2013, the Federal Highway Administration rated 45% of the roadways as poor and only 16% as good.[76] Finally, many tribal areas are isolated from large urban markets, causing them to rely on a much smaller and less dense local customer base, making it difficult for businesses to gain market share. This also isolates Native American entrepreneurs from business support services and business development advice and reduces access to professional networks.[77] However, geographic remoteness may also act to protect established businesses from competition and be a factor in the longer term survival of some Native American businesses[78].
Small Farm Lending
Land dispossession and reduced access to prime agricultural land has impacted Native American farmers since their first contact with Europeans. Federal policies such as the Dawes Act had major repercussions on land tenure and farming over the past century. The 2017 USDA Census of Agriculture reports there were 79,198 Native American producers who made $3.5 billion in sales working 59 million acres of farms. Arizona has the largest number of Native American producers (11,561) and cultivated acres (20,117,766) in the country.[79] New Mexico has 5,911 producers operating on 7,314,463 acres. However, USDA policies of paying agricultural operators not to actively farm their land may overemphasize the extent of agricultural activity. One study found that in 2012 almost one-third of Native American farms showed zero sales revenue. Though agricultural producers on tribal land are overwhelmingly Native Americans (75%), their farms generated only 10% of the revenue of agricultural products produced there in 2012 ($361 million compared to $3.4 billion).[80] A Government Accounting Office study from 2019 details challenges in accessing the farm credit system that are similar to those facing other Native American small businesses.[81] As with home and small business lending, Native American farmers are impeded from credit by the difficulty they face in collateralizing land, often-inadequate credit histories, regulatory complexity and lack of infrastructure or resources. In the case of farming, these challenges make the purchase of irrigation systems, seed and equipment difficult.[82] One survey of Native American agricultural producers, finding that financing and funding (63% of respondents) was the most needed business development resource, followed by marketing support (49%) and technical assistance (37%). The historic deprivation of capital to Native farmers and ranchers – wherein the United States Department of the Agriculture was found complicit – is memorialized in the class-action lawsuit KeepsEagle v Vilsack, which resulted in the establishment of the Native American Agriculture Fund in 2018.
Access to Financial Services
Lack of financial access by Native American communities has been a long-standing concern. In 2001, a CDFI Fund survey found that respondents were generally concerned about the lack of financial services locations on or near tribal lands.[83] The absence of bank branches or even ATMs on or within tribal areas impeded bank-community relationships. One-third of respondents indicated that they had to travel more than 30 miles in order to reach an ATM or branch. The rurality and isolation of many reservations impact access: The Navajo Nation, for instance, is served by only five branches operated by Wells Fargo and one ATM over 17 million acres of land.[84] Other large tribal areas such as the Hopi, Hualapai, San Carlos, Tohono O’odham reservations and many pueblos have no bank branches within or near to their boundaries.
In 2019 one out of every 20 US households lacked a bank account. For Native American households in that year – which was the last before the 2020 Census changes injected enormous statistical noise to such measures – the unbanked share was roughly one in six.[85] A combination of availability and demand factors may also shape the low levels of financial access. Issues impacting the availability of services, such as the distance to branch locations and relatively low levels of internet and mobile phone availability for Native Americans, are geographic factors that limit financial access. Some authors also cite cultural reasons impacting demand for the low rate of financial services usage.[86] High levels of poverty coinciding with low levels of financial literacy and an active informal economy may suppress demand for financial services creating a vicious cycle of reduced demand – reduced access and persisting poverty. Additionally, a past history of outside businesses and financial institutions engaging in predatory practices, and cooperating with wage garnishment and vehicle repossessions, has resulted in a legacy of distrust.[87] Financial institutions may be reluctant to locate branches in tribal areas due to low expectations of profitability and/or discriminatory and stereotypical perceptions of Native American people.[88]
Testimonials collected for this study generally relate implicit and explicit discrimination against Native Ameicans by conventional lenders, as well as aggressive marketing tactics by predatory lenders. The combination of distrust of established institutions combined with the process level user-friendliness of extremely high-cost products marketed by predatory lenders is likely another major factor in limited access to capital as well as persistent poverty among Native Americans.
Specialized financial services providers like CDFIs can provide services that enhance access for Native American communities. CDFIs are specialized, mission-driven corporations that prioritize economic development for communities. A report by the Federal Reserve Bank of Minneapolis found that Native CDFIs located on or near tribal lands improve credit outcomes for participating Native American people. Activities such as financial education and credit repair focused on individuals significantly raised credit scores and boosted lending.[89] While the number of Native CDFIs quadrupled from 16 in 2001 to 64 in 2022, only eight are located in Arizona and New Mexico. The primary challenges facing Native CDFIs were 1) improved cooperation with tribal governments; 2) better data to measure impact; and 3) greater access to capital to finance lending. Improvement of collaboration and coordination with tribal governments is an issue that is distinct to some Native nations depending on their governance structure. Issues with data and capital access are not unique to Native CDFIs and impede the operation of many CDFIs.
Appendix B: Methodology
Data and Methods
Study Area
This study focuses on the Native American tribal lands located specifically within the states of Arizona and New Mexico. Tribal areas that extend beyond these states into Utah and Colorado, including the territories of the Navajo Nation and Southern Ute, were purposefully excluded to maintain the state-specific focus of the analysis. The focus on tribal areas purposely zeros-in on social and economic development, and financial access relating to Native Americans who may be living in very difficult circumstances of concentrated poverty. Additionally, inconsistent and unreliable data have been a persisting problem in the Census counts and estimates of Native Americans. This issue is compounded in the 2020 census by a large shift in the number of Americans choosing to identify as “American Indian Alaskan Native” compared to the 2010 census. In 2010, 5.2 million respondents identified as Native American. In 2020, that number nearly doubled increasing to 9.7 million in 2020. This shift in how respondents identify has downstream impacts on measures of social and economic well-being. It also impacts data on small business ownership. For instance the Census Annual Business Survey completed in 2019 found 26,064 Native American owned employer businesses, then recorded a 54% increase to 40,392 the following year after the new demographic standards were introduced. increasing 54% in 2020, after the new demographic standards were introduced, to 40,392. Our report focuses on financial access in tribal areas and mitigates the impact of this demographic realignment through its concentration on tribal lands, with their high proportions of Native American residents.
The research methodology involved a detailed comparison of lending and financial access offered by conventional financial institutions and banks within the counties of Arizona and New Mexico that contain tribal areas. Although the lending activity by non-bank Native CDFIs is notable and growing, this study focused on the challenges Native Americans continue to face in accessing capital from conventional financial institutions. To facilitate this, the study identified and utilized US census tracts that overlapped with tribal territories. Four distinct categories were created based on the percentage of tribal land within each tract:
- “Tribal lands” refer to tracts that are exclusively tribal territories, ranging from 98% to 100% of the tract area.
- “Primarily tribal areas” include tracts that consist of 50% to 98% tribal lands.
- “Tribally impacted areas” encompass tracts where tribal lands constitute 2% to 50% of the total area.
- “No Tribal Area” categorizes tracts with minimal or no tribal presence, specifically 0% or 2% tribal lands.
This is the specific method used to categorize the % area of the Census Tract that is Tribal.
Percent Tribal < 2% = No Tribal Area
Percent Tribal >= 2% and < 50% = Tribally Impacted Areas
Percent Tribal >= 50% and < 98% = Primarily Tribal Areas
Percent Tribal >=98% = Tribal Lands
This categorization process was designed to account for minor discrepancies between tribal boundaries and census tract boundaries. The 2020 Census tract boundaries were consistently applied throughout the study to ensure uniformity.
However, it is essential to note that the study could not incorporate the US Census-designated tribal census tracts. This was due to compatibility issues with the primary economic and locational data sources used in the research, which were drawn from organizations such as the
Home Mortgage Disclosure Act (HMDA), the Federal Financial Institutions Examination Council (FFIEC), the Native American National Data Alliance (NaNDA) and other similar entities. Consequently, alternative methods were employed to align the data sources with the selected geographic framework.
Data
Data from the Home Mortgage Disclosure Act (HMDA) spanning 2018 to 2021 was utilized to study mortgage lending to applicants identified as Native American, either as the primary or secondary race. This includes both individual applicants and co-applicants in the designated study area, as well as lending activities occurring on or near tribal lands. This information was retrieved from the Consumer Finance Protection Bureau (CFPB), where the race was determined for all loan records if there was any mention of Native American status by either applicant.
Additionally, the study has omitted those cases deemed exceptional. Specifically, any records with property values or interest rates that were more than two standard deviations from the average were removed. This led to the exclusion of 12,374 applications, representing 0.0048% of all loan applications, from the analysis.
The small business analysis relied on several sources of data. The 2020 Census Annual Business Survey (ABS) captures pre-COVID 19 pandemic employer business statistics at the national level. Locational information on the number of businesses in operation at the census tract level was gathered from the January 2020 HUD Aggregated USPS Administrative Data on address vacancies file. Information on income classification and the number and amount of small business loans in census tracts was drawn from the FFIEC Community Reinvestment Act aggregate report covering the period from 2018-2021. The FFIEC report is the most comprehensive data available covering small business lending, but there are many gaps in its reporting since it only covers larger banks with assets exceeding $1.305 billion. An additional resource for assessing pandemic era lending and grants was the Paycheck Protection Program (PPP) data file of loans made under that program. All of the data was assessed by matching lending to the tribal land classifications in Arizona and New Mexico. Federal income level classifications from the FFIEC were also applied to assess differences in low- to moderate-income (LMI) and middle- to upper-income census tracts in 2021.
Demographic and socioeconomic data concerning the US Census American Indian Alaskan Native (AIAN) race classification were taken from the American Community Survey 1-year (2021) and 5-year (2017-2021) data. This included the data on housing access and the data used to calculate the index of concentrated disadvantage (ICD). The ICD uses census tract-level data on the percentages of people in poverty, unemployment, reliance on federal assistance, female-headed households and the% of children in its calculation. It is a widely used indicator of well-being and health which operationalizes factors of social and economic disadvantage that also have a bearing on the more general considerations of the social determinants of health.
Financial Needs Index
The Financial Needs Index (FNI) is an index that determines the level of access and need of communities within a given area for a bank branch or credit union. It evaluates need by assessing population characteristics and density combined with measures related both to mobile and physical access. Variables used to calculate the FNI included population density, minority population as a percentage of total population,% of households with a paid internet subscription,% of households with access to at least one smartphone,% of owner-occupied households without a vehicle,% of owner-occupied households without a landline telephone connection and distances to the nearest bank branch and credit union. By using these measures, the FNI comprehensively assesses comparative levels of financial access in different areas.
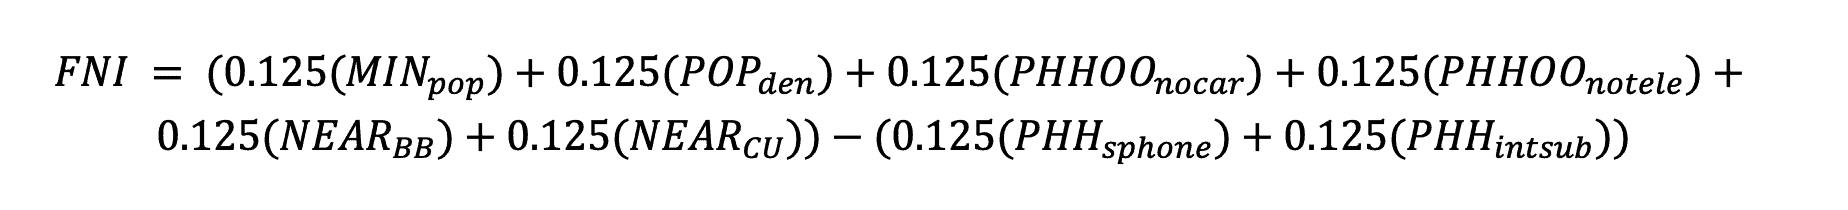
All variables except distances were sourced from 2017-2021 ACS 5-year estimates at the block group level. This data, with its lower margins of error, provides the greatest level of precision and validity in estimating financial access of communities. Distances were calculated using the “Near” tool of the ArcGIS mapping software, which calculated the nearest bank branch and credit union facilities to the center of each census block group. All measures were then normalized for comparisons using their z-scores and then added together using the following formula:
The variables in the formula are listed below.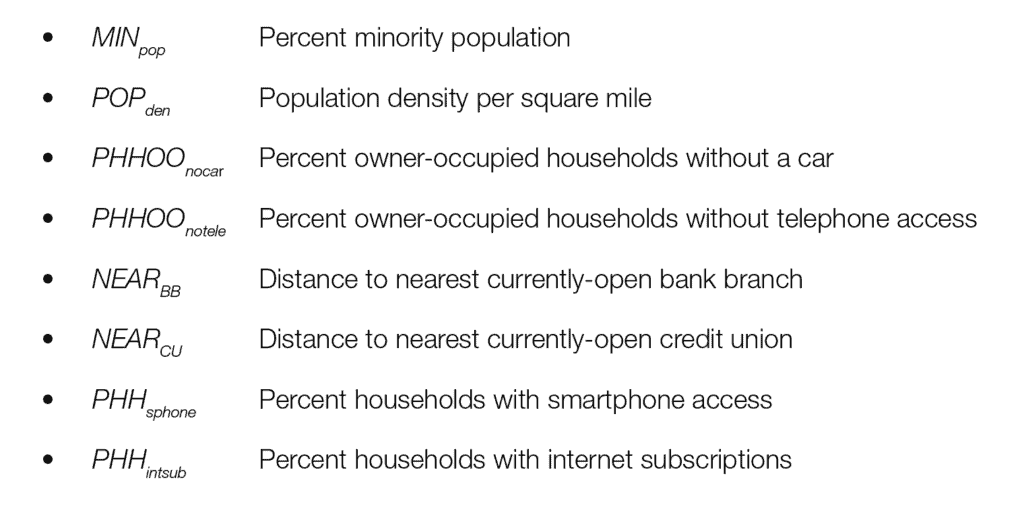
We also found that tribal lands had higher financial need scores. The more tribal lands in an area, the higher the need (with a specific statistical measurement of r = 0.288, p < .001).
Figure 24
We used ArcGIS to analyze the data in connection with Census 2020 boundaries, adjusting for urban-rural differences by including population density. We then divided the results into four equal parts, ranging from “low need” to “very high need,” to understand the specific needs of the communities in the area of interest.
References
Akee, R., Mykerezi, E., & Todd, R. (2020). Business dynamics on American Indian Reservations: Evidence from longitudinal datasets (No. 20-38).
Arias, E., Xu, J., Curtin, S., Bastian, B., & Tejada-Vera, B. (2021). Mortality profile of the non-Hispanic American Indian or Alaska Native population, 2019.
Banga, H., Feir, D.L., & Gregg, M.T. (2023). The unequal costs of Native American homeownership,
Center for Indian Country Development, Federal Reserve Bank of Minneapolis. Working paper.
Bauer, A., Feir, D. L., & Gregg, M. T. (2022). The tribal digital divide: Extent and Explanations. Telecommunications Policy, 46(9), 102401.
Benson, D. A., Lies, A. K., Okunade, A. A., & Wunnava, P. V. (2011). Economic impact of a private sector micro-financing scheme in South Dakota. Small Business Economics, 36, 157-168.
Bressler, M. S., Campbell, K., & Elliott, B. (2014). A study of Native American small business ownership: Opportunities for entrepreneurs. Research in Business and Economics Journal, 10, 1.
Buckley, J., & Kashian, R. (2019). Ownership effects among Native American banks, 2001-2016. Applied Economics, 51(2), 181-195.
Cattaneo, L., & Feir, D. (2021). The price of mortgage financing for Native Americans. Journal of Economics, Race, and Policy, 4, 302-319.
Colbourne, R. (2017). An understanding of Native American entrepreneurship. Small Enterprise Research, 24(1), 49-61.
Cornell, S., & Kalt, J. P. (2010). American Indian self-determination: The political economy of a policy that works. Working paper of the Harvard Kennedy School of Government
Crepelle, Adam. “How Federal Indian Law Prevents Business Development in Indian Country.” Univ. Pennsylvania Journal of Business Law. 23 (2020): 683
Curtice, K., & Choo, E. (2020). Indigenous populations: left behind in the COVID-19 response. The Lancet, 395(10239), 1753.
Cyree, K. B., Harvey, K. D., & Melton, M. R. (2004). Bank lending to Native American applicants: an investigation of mortgage flows and government guarantee programs on Native American lands. Journal of Financial Services Research, 26, 29-54.
Dewees, Sarah, and Stewart Sarkozy-Banoczy. “Investing in native community change: Understanding the role of community development financial institutions.” Washington, DC: US Department of the Treasury, CDFI Fund (2008).
Dimitrova-Grajzl, V., Grajzl, P., Guse, A. J., & Todd, R. M. (2015). Consumer credit on American Indian reservations. Economic Systems, 39(3), 518-540.
Dimitrova-Grajzl, V., Grajzl, P., Guse, A.J. et al. (2018). Neighborhood Racial Characteristics, Credit History, and Bankcard Credit in Indian Country. Comparative Economics Studies. 60, 410–441
Dimitrova-Grajzl, Valentina, et al. (2022). “Community development financial institutions and individuals’ credit risk in Indian Country.” Journal of Economic Issues 56.1, 184-208.
Edwards, K. (2008). Borrowing trouble: Predatory lending in Native American communities. First Nations Development Institute.
Erdmann, S. J. (2016). American Indian entrepreneurs’ perceptions of their success in establishing businesses on or near reservation in Wisconsin. Journal of Developmental Entrepreneurship, 21(03), 1650017.
Franklin, R. J., Morris, M. H., & Webb, J. W. (2013). Entrepreneurial activity in American Indian nations: Extending the GEM methodology. Journal of Developmental Entrepreneurship, 18(02), 1350009.
Garza, Lilli Y., et al. (2022). “First to Reside, Last to Benefit: A Study of Midwestern Tribal Efficiency.” Mid West Energy Efficiency Alliance.
Guedel, W. Gregory, and J. D. Colbert. (2016). “Capital, Inequality, and Self-determination: Creating a Sovereign Financial System for Native American Nations.” American Indian Law Review, vol. 41, no. 1, 2016, pp. 1–49.
Henry-Winkie, M, and Seo, R., (2022) Creating community determined rural policies: How Native women transform challenges into impactful social entrepreneurship. Brookings Institution, GS_IOP_indigenous-rural-081222.pdf (brookings.edu)
Hogan, A. E. (2020). Mortgage Lending on Tribal Lands: Federal Fair Lending Protections, Public-Private Partnerships, and Tribal Solutions for Increasing Access to Mortgage Credit on Tribal Lands. Am. Indian LJ, 9, 41.
Jorgensen, M. (2016). Access to capital and credit in Native communities. Native Nations Institute, University of Arizona.
Kingsley, G. T., Mikelsons, M., & Herbig, C. (1996). Housing problems and needs of American Indians and Alaska Natives. Report prepared by the Urban Institute for the US Department of Housing and Urban Development (HUD). May. Washington, DC: HUD.
Kokodoko, Dimitrova-Grajzl, V., Grajzl, P., Guse, J. (2021). Native CDFIs improve credit outcomes for Indian Country residents. Federal Reserve Bank of Minneapolis Native CDFIs improve credit outcomes for Indian Country residents | Federal Reserve Bank of Minneapolis (minneapolisfed.org)
Kunish, Patrice. (2018). Tribal Leader’s Handbook on Homeownership. Federal Reserve Bank of Minneapolis and Enterprise Community Partners
Laderman, E., & Reid, C. (2010). Mortgage lending on Native American reservations: Does a guarantee matter?. Journal of Housing Economics, 19(3), 233-242.
Listokin, Y. (2001). Confronting the barriers to Native American homeowners on tribal lands: The case of the Navajo Partnership. The Urban Lawyer, 44(2), 433-476.
Listokin, D., Temkin, K., Pindus, N., Stanek, D. (2017) Mortgage lending on tribal land: A report from the assessment of American Indian, Alaskan Native, and Native Hawaiian housing needs, Report prepared by the Urban Institute for the US Department of Housing and Urban Development (HUD). Washington, DC: HUD
Lofthouse, J. K. (2019). Institutions and economic development on native American lands. The Independent Review, 24(2), 227-248.
Maxim, R., Sanchez, G., Huyser, K. (2023). Why the federal government needs to change how it collects data on Native Americans. Brookings Institution
Miller, D. K. (2019). Indians on the move: Native American mobility and urbanization in the Twentieth Century. UNC Press Books.
Mucioki, M., Hoover, E., Sowerwine, J., Johnson-Reyes, K., Redhouse, L., & Cornelius, D. (2022). Native American agriculture and food systems: Challenges and opportunities presented by the COVID-19 pandemic. Journal of Agriculture, Food Systems, and Community Development, 11(3), 121-137.
National Community Reinvestment Coalition. (2002, March). Anti-predatory lending toolkit. Washington, DC: National Community Reinvestment Coalition.
Pindus, Nancy, et al. “Housing needs of American Indians and Alaska Natives in tribal areas: a report from the assessment of American Indian, Alaska Native, and Native Hawaiian housing needs: executive summary.” US Department of Housing and Urban Development, Office of Policy Development and Research (2017).
Richardson, Jason. (2023). Native Americans Struggle To Obtain Credit: A Close Analysis Of Native American Mortgage Lending From 2018-2021. National Community Reinvestment Coalition
Richardson, J. (2022). Initial Analysis Of 2021 HMDA Data: The Year That Homes Became ATMs Again. National Community Reinvestment Coalition
Rosenberg, N. (2017). Farmers who don’t farm: The curious rise of the zero-sales farmer. Journal of Agriculture, Food Systems, and Community Development.
Shinstine, D. S., & Ksaibati, K. (2015). Road Safety Improvement Program on Indian Reservations in North Dakota and South Dakota. Transportation Research Record, 2531(1), 146-152.
Smith, Kyle (2003). Predatory Lending in Native American Communities. Fredericksburg, VA: First Nations Development Institute.
Swimmer, Ross O. “A blueprint for economic development in Indian Country.” J. Energy Law & Policy 10 (1989): 13
Todd, R. & Johnson, K. (2019). The Value of HMDA Coverage of Home Lending in Rural Areas and Indian Country. Center for Indian Country Development of the Minneapolis Federal Reserve, Working Paper
United States Government Accountability Office. (2019). Agricultural Credit Needs and Barriers to Lending on tribal lands. Indian Issues
Wang, H. (2021). Why the Navajo Nation was hit so hard by coronavirus: Understanding the disproportionate impact of the COVID-19 pandemic. Applied Geography, 134, 102526.
Wellhausen, R. L. (2017). Sovereignty, law, and finance: Evidence from American Indian reservations. Quarterly Journal of Political Science, 12(4), 405-436
Yellow Horse, A. J., Yang, T. C., & Huyser, K. R. (2021). Structural inequalities established the architecture for COVID-19 pandemic among native Americans in Arizona: a geographically weighted regression perspective. Journal of Racial and Ethnic Health Disparities, 1-11.
Yonk, R. M., Hoffer, S., & Stein, D. (2017). Disincentives to business development on the Navajo Nation. Journal of Developmental Entrepreneurship, 22(02), 1750012.
[1] See the My Tribal Area Glossary at https://www.census.gov/tribal/tribal_glossary.php
[2] See the The Myth of the Vanishing Indian from the White House Historical Association. Sarah Fling************
[3] Lofthouse. Pg. 242 (2019)
[4] Miller (2019)
[5] Cornell and Kalt (2010)
[6] CDFI Fund (2017) ******
[7] Swimmer (1989)
[8] Yonk et al. (2017)
[9] Arias et al.. (2021)
[10] Ibid.
[11] Wagner Daniel & Baker, Mike. (2015)
[12] See the CDFI Fund Iniatives Facksheet- https://www.cdfifund.gov/sites/cdfi/files/2022-11/Native_Initiatives_FactSheet.pdf
[13] Kokodoko et al. (2021)
[14] Todd, R & Johnson, K. (2019)
[15] Eisen, B. (2021, Aug. 29) Scarce Credit Hinders Homeownership on Tribal Land. The Wall Street Journal.
[16] Wang, H. (2021). Why the Navajo Nation was hit so hard by coronavirus: Understanding the disproportionate impact of the COVID-19 pandemic. Applied Geography, 134, 102526.
[17] Yellow Horse, A. J., Yang, T. C., & Huyser, K. R. (2021). Structural inequalities established the architecture for COVID-19 pandemic among native Americans in Arizona: a geographically weighted regression perspective. Journal of Racial and Ethnic Health Disparities, 1-11.
[18] https://ncrc.org/wp-content/uploads/2007/07/ncrc%20metro%20study%20race%20and%20income%20disparity%20july%2007.pdf
[19] Smith, Kyle (2003). Predatory Lending in Native American Communities. Fredericksburg, VA: First Nations Development Institute.
[20] Cattaneo & Feir. (2020)
[21] Hogan. (2020)
[22] Laderman & Reid. (2010)
[23] Lofthouse (2019).
[24] HUD. (2017)
[25] Mann, Lina. self determination without termination. The White House Historical Association****
[26] Cataneo & Feir. (2020)
[27] Cyree et al. (2004)
[28] Dimitrova-Grajzl et al. (2014)
[29] Lederman op. cit.
[30] Hogan. (2020)
[31] Listokin et al. (2017)
[32] Swimmer. (1989)
[33] CDFI Fund (2001)
[34] CDFI Fund (2007)
[35] Listokin et al. (2017)
[36] HUD (2017)
[37] Kunish, Patrice (2018)
[38] Maxim, Robert. (2023)
[39] Hermann Alexander. (2023). In Nearly Every State People of Color Are Less Likely to Own Homes Compared to White Households. Joint Center for Housing Studies at Harvard University
[40] *****
[41] Hermann, op. cit.
[42] ****
[43] Kunish, op. cit.
[44] Hogan (2020)
[45] Listokin (2001)
[46] Pindus (2017)
[47] HUD (2017)
[48] Ibid.
[49] *** https://www.hud.gov/section184
[50] Kingsley (1996)
[51] CDFI Fund (2001)
[52] Cyree et al. 2004
[53] Laderman & Reid (2010)
[54] Pindus (2017)
[55] Cattaneo & Feir (2020)
[56] Lederman & Feir (2010)
[57] Banga et al. (2023)
[58] Cattaneo, op. cit.
[59] Richardson, J. (2023)
[60] Banga, op. cit.
[61] Hogan (2020)
[62] Ibid.
[63] Ibid.
[64] Ibid.
[65] Erdmann (2016)
[66] Padilla Melendez et al. (2022)
[67] Colbourne (2017)
[68] Colbourne
[69] Erdmann (2016)
[70] Henry-Winkie & Seo. (2022)
[71] Erdmann, op. cit.
[72] Dimitrova Crajzl et al. (2014)
[73] Akee et al. (2020)
[74] Bauer et al. (2022)
[75] Mallet, William. (2020)
[76] Shinstine et al. (2015)
[77] Erdmann (2016)
[78] Akee et al. (2021)
[79] 2017 USDA Census ******
[80] United States Government Accountability Office. (2019)
[81] Ibid.
[82] Mucioki et al. (2022).
[83] CDFI Fund (2001).
[84] ibid.
[85] See Appendix Tables of the 2021 FDIC National Survey of Unbanked and Underbanked Households****
[86] CDFI Fund (2001), pg. 17
[87] Henry-Winkie & Seo. (2022)
[88] CDFI Fund (2001)
[89] Kokodoko. (2021)
