T
Barbara Van Kerkhove, Ph.D., Researcher/Policy Analyst, Empire Justice Center
Ruhi Maker, Esq., Senior Attorney, Empire Justice Center
This is one in a series of essays accompanying NCRC’s 2020 analysis that showed more chronic disease and greater risks from COVID-19 in formerly redlined communities. The views and opinions expressed in this article are those of the author and do not necessarily reflect the views or policy positions of NCRC.
On June 3, a group of Rochester’s Black and Latino community leaders declared racism a public health crisis. They urged communities of color to remain vigilant in fighting the spread of COVID-19.
The groups, La Cumbre and the Greater Rochester Black Agenda Group, linked the disparate impact of COVID-19 on Black and Brown communities to the fact that Black and Latinx people disproportionately suffer from various health conditions that are COVID-19 comorbidities. With the new report from NCRC and their academic partners, we know these comorbidities are a direct result of segregation in housing.
Racially based segregation and discrimination are rooted in systems put in place starting over 400 years ago, when this country was settled by Europeans on land stolen from indigenous peoples and worked by peoples from Africa who were kidnapped and enslaved. This system required the creation of a racial hierarchy to justify and perpetuate it.
Rochester and the surrounding communities once belonged to the people of the Haudenosaunee Confederacy. These lands were expropriated and settled by Whites who employed slaves much like the rest of North America at that time. While Rochestarians are proud that Frederick Douglass and Susan B. Anthony are integral to our identity, we are just beginning to uncover and understand the grimmer aspects of our history.
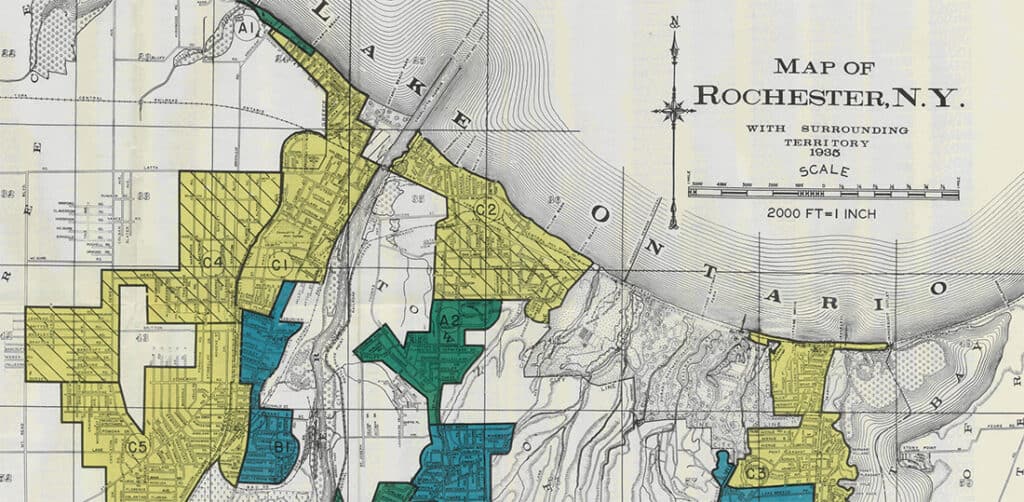
This includes the long legacy of structural racism in Rochester’s housing market. One early way structural racism raised its ugly head was through residential redlining, which was launched by the federal government through the Home Owners Loan Corporation (HOLC) Residential Security Maps. The HOLC developed the grading process used to prepare these maps during the Great Depression to help the federal government decide which mortgages were safe to insure, and to persuade banks to extend mortgage credit to homeowners. Neighborhoods that were home to a majority of people of color were given the lowest grade, “D-hazardous,” resulting in residential segregation on racial lines. (The other grades were: “A-Best,” “B-Still Desirable,” “C-Definitely Declining.”)
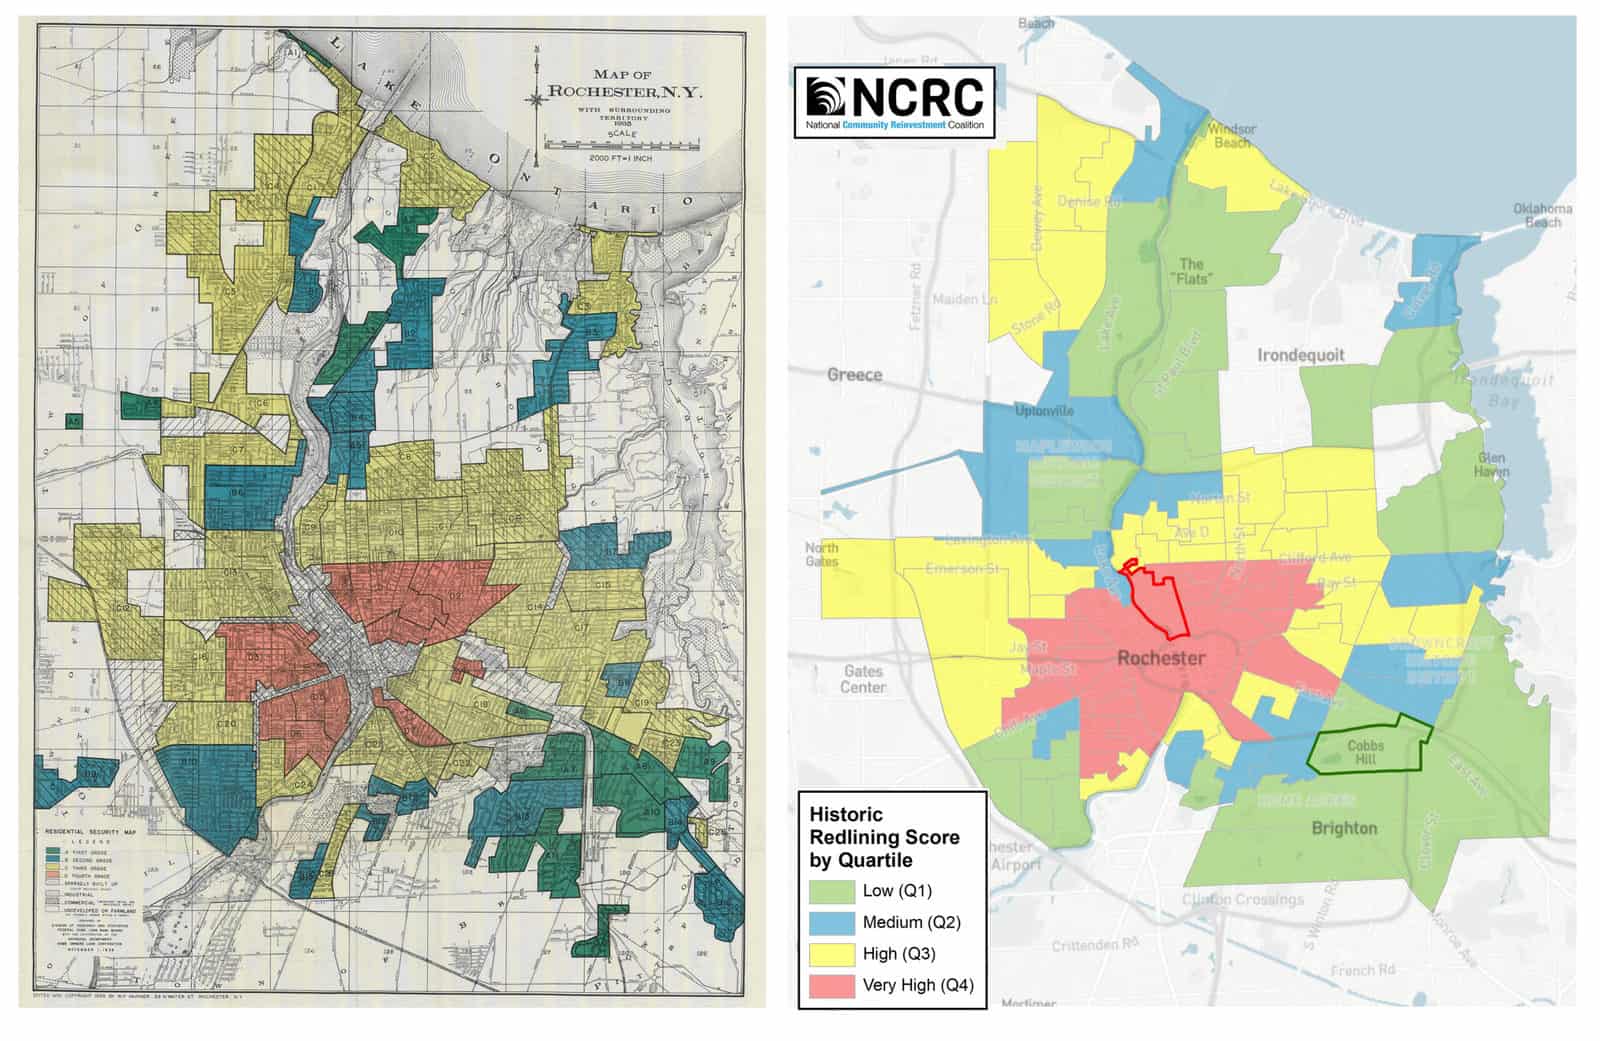
Figure 1: 1938 HOLC “Residential Security” Map compared to NCRC Historic Redlining Score by Census Tract
Racial residential segregation was implemented by other means in Rochester as well. The city was one of the destinations for Blacks moving north during the Great Migration. “As tens of thousands of black people arrived in Rochester from the South in the 1950s and 1960s, they were met with a sophisticated, far-reaching, government-sponsored infrastructure dedicated solely to keeping them out of ‘respectable’ white neighborhoods, both in the city and the suburbs.” This infrastructure included discriminatory policies and practices in the real estate industry; refusal by banks and other lending institutions to lend in redlined neighborhoods or to Blacks buying in White neighborhoods; and deed restrictions and racial covenants.
This summer, Yale researchers found that the White elite of Rochester played a role in creating the wealth and income inequities that persist today. According to the report:
Racial covenants helped segregate neighborhoods by backing up the White supremacist effort to divide and control Monroe County with the power of judges, juries, police, and entire neighborhoods. Covenants did so by fusing a legally enforceable rule of segregation with a socially enforceable norm of segregation.
Black families were thus forced to reside in crowded, unsafe housing in parts of what are now the Corn Hill and Upper Falls neighborhoods. This was the tinder that only needed a spark for the July 1964 uprising/rebellion.
Unfortunately, racial residential discrimination in Rochester didn’t stop after the uprising or after the Fair Housing Act was passed in 1968. Neighborhood disinvestment and lack of homeownership opportunities has continually resulted in African Americans not receiving loans. In 1992, the Empire Justice Center, Melissa Marquez, now CEO of the Genesee Coop FCU and other not-for-profit organizations in the area, convened the Greater Rochester Community Reinvestment Coalition (GRCRC). Based on its analysis of home mortgage lending data, the GRCRC issued its first report in the early ‘90s, documenting that White low-income households and neighborhoods in Rochester received four times as much lending as middle-income Black households and neighborhoods. Black households were unable to grow their equity due to their inability to get affordable loans, or often any loans at all. Homes are one of the main assets of Americans. The historical lack of lending has created enormous wealth disparities between Whites and people of color.
Residential segregation led to racial disparities in public health in Rochester much like it has in most urban areas in the U.S. Children in aging houses were exposed to lead paint. Black and Brown neighborhoods lacked access to fresh foods as grocery stores moved to the suburbs. There are fewer safe and healthy public spaces in segregated neighborhoods.
Housing discrimination also led to a highly segregated educational system. The Rochester City School District (RCSD) educates a city with the highest concentration of child poverty in the country, while it is surrounded by affluent suburbs with well-resourced schools.
Rochester’s long history of residential segregation also affects how residents in the city of Rochester are policed. Officers employed by the city overwhelmingly choose not to live in the redlined neighborhoods they serve. It’s no surprise, then, that Daniel Prude, a Black man, was murdered in March of this year by RPD officers in the heart of a neighborhood redlined by the Federal Home Loan Bank in 1938. The officers were responding to a 911 call from Joe Prude, who was seeking help for his brother after he ran from the house in the early morning hours in apparent mental distress. Systemic racism, of which redlining is just one manifestation, created the conditions — the segregation, the racist history of policing, health and health care disparities, a Black man’s mental health crisis, and the callous response by police officers — that ultimately led to Prude’s death.
The legacy of residential segregation and structural racism also impedes access to healthcare, produces psychosocial stress and reinforces the implicit bias of health care providers against people of color. All of these factors add to racial inequities in health outcomes, both mental and physical, which we see illustrated in the two census tracts highlighted in the table and maps below.
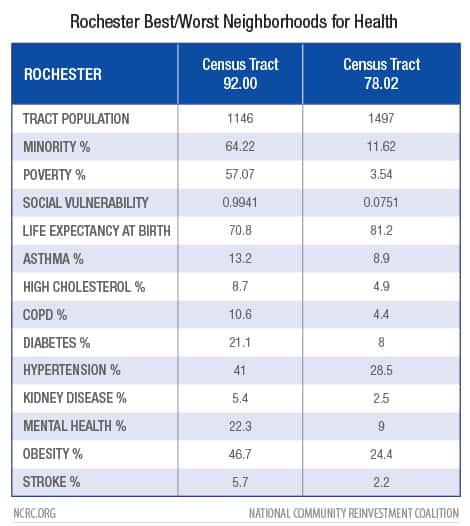
Table 1: Rochester Best/Worst Neighborhoods for Health
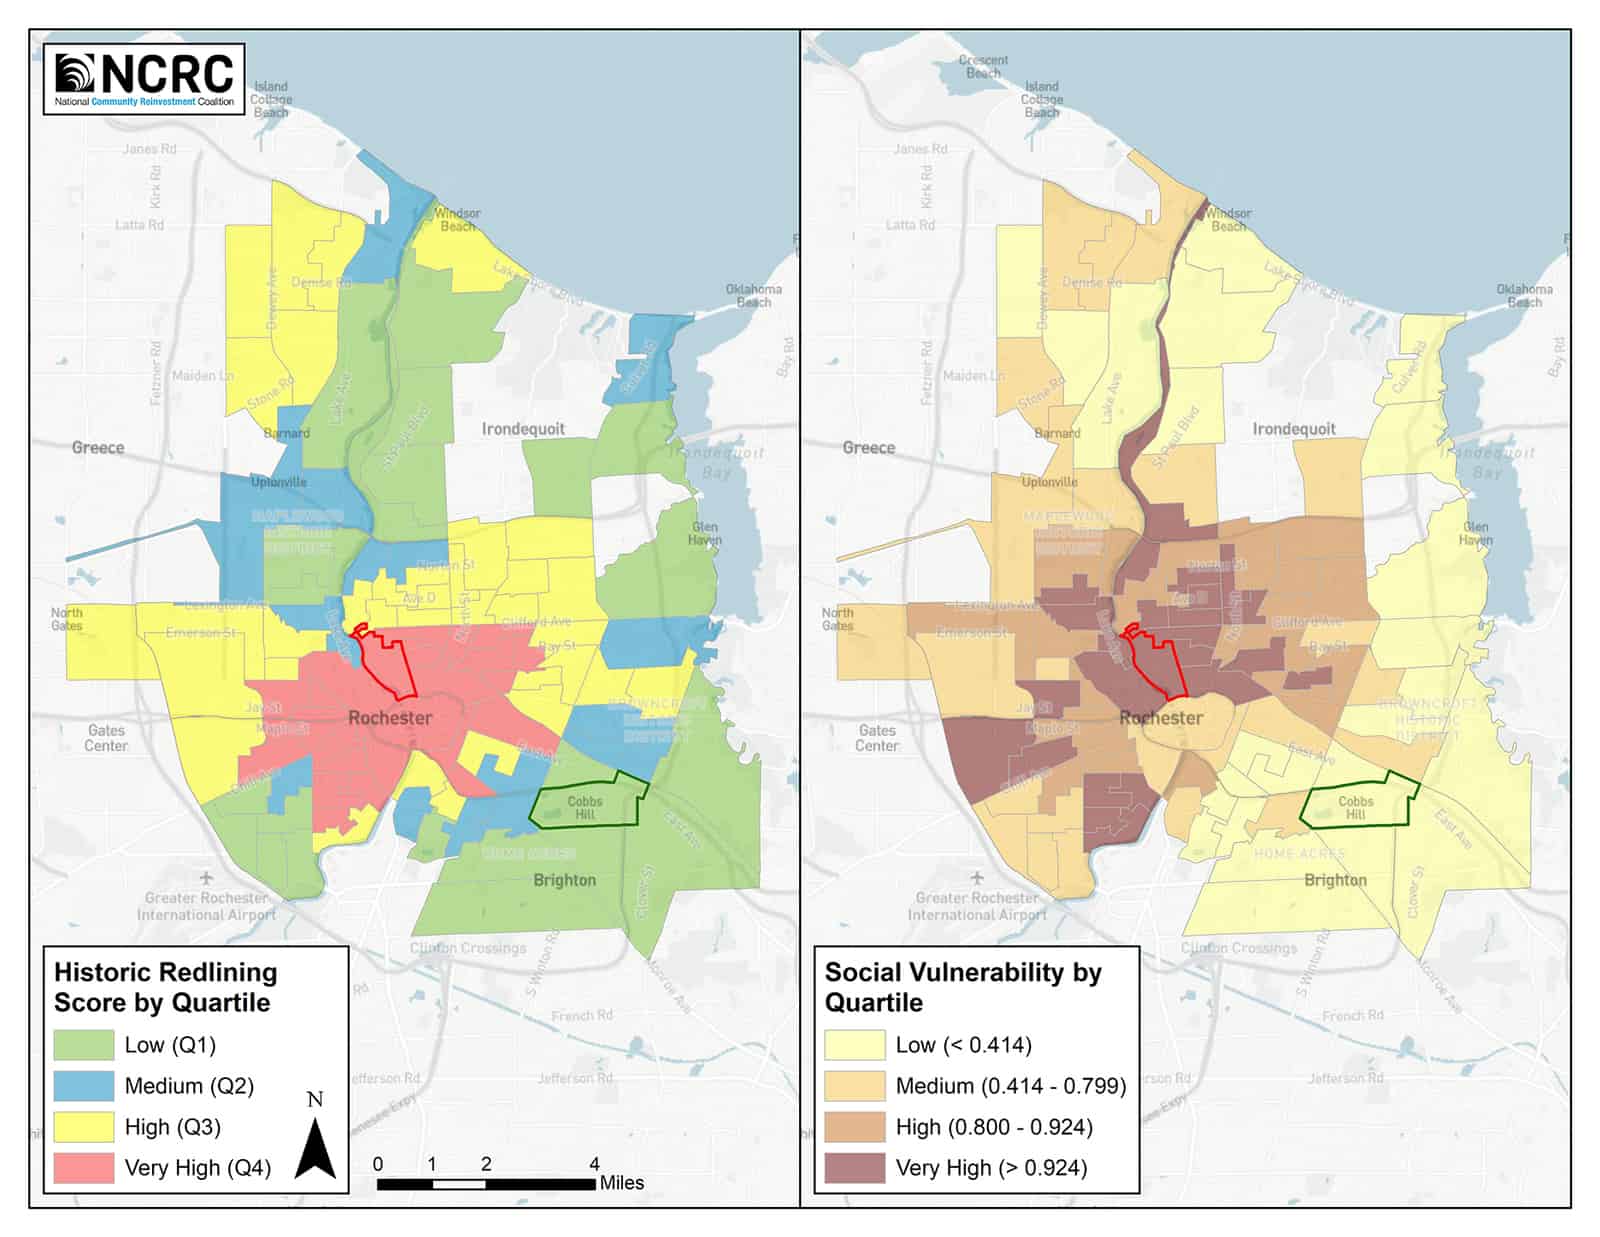
Figure 2: Historically Redlined Neighborhoods and Social Vulnerability
Census tract 92 (outlined in red), located northeast of the central business district in zip code 14605, is part of the Upper Falls Neighborhood. It is red (Q4) in the Historic Redlining Score map, meaning it was one of the most redlined. Census tract 78.02 (outlined in green), in zip code 14610, is part of the Cobbs Hill Neighborhood. It is green (Q1) in the Historic Redlining Score map, meaning it was one of the least redlined areas.
The NCRC report includes a CDC Social Vulnerability Index (SVI) to evaluate the resilience of neighborhoods to a wide range of hazards including human and natural disasters and outbreak of diseases, such as COVID-19. Census tracts 92 and 78.02 are highlighted here because they have the highest and lowest SVI scores, respectively, among the areas mapped on the HOLC maps. In addition, many of the other indicators of ongoing segregation and disparate health outcomes also align as one would expect. (See Table 1 above.)
- Census tract 92 has an SVI score of .99; 64% of the population is majority nonWhite; and 58% lives in poverty.
- Census tract 78.02 has an SVI score of .08; 12% of the population is majority nonWhite; and 4% lives in poverty.
Health outcomes are worse for Census tract 92, as seen in Table 1. Life expectancy in CT 92 is 10 years lower than in CT 78.02 (see also map below). Health indices related to stroke, diabetes, COPD and other COVID-19 risk factors are 30–60% higher in CT 92 than CT 78.02.

Figure 3: Historically Redlined Neighborhoods and Life Expectancy
Housing Segregation and the COVID-19 Pandemic
As has been documented across the country, COVID-19 cases and deaths are disproportionately hitting Black and Latinx people in Monroe County and in historically redlined neighborhoods in Rochester.
According to the July 15 report of the Monroe County Department of Health,
- The rate of COVID-19 cases among Black people in Monroe County is 4 times that of White people
- The rate of COVID-19 cases among Latinx people is 2.5 times that of White people
- Black and Latinx people are more than twice as likely than White people to die from COVID-19
Data released by the Monroe County Department of Health at the end of July shows that the five zip codes with the highest rates of COVID-19 per 100,000 in Monroe County are: 14605, 14608, 14611, 14619 and 14621. The rates in these areas range from 1,224 per 100,000 to 1,046 per 100,000. The median household incomes in these areas range from $21,000 to $39,000, and their composition is 60-88% nonWhite (as seen by the American Community Survey 2013-2018).
By comparison, Monroe County, as a whole, has a much lower COVID-19 rate, 623 per 100,000, a much higher median household income, $60,222, and a relatively low 30% nonWhite population.
The high rates of COVID-19 cases in these five zip codes align with what is being found around the country and with NCRC’s report. They have the highest percentages of people of color and some of the lowest income levels, and all of them are in the city of Rochester. Four of these five zip codes cover most of the census tracts with the highest redlining scores (red tracts) outside of the central business district (circular tract in middle of map) in NCRC’s redlining map. Zip code 14619, the 19th Ward neighborhood, was scored as still desirable in the 1935 HOLC map.
In addition to the impacts of segregation outlined above, people who live in formerly redlined neighborhoods tend to work at higher-risk essential jobs, are paid less than a living wage, do not have sufficient health insurance and/or do not have family or sick leave. It is no wonder they have higher COVID-19 infection rates.
These patterns impact all low-income New Yorkers but have a disproportionate impact on Black and Brown communities because of what Isabel Wilkerson calls America’s caste system.
Recommendations
In order to effectively address segregation, discrimination and the disparate impact of COVID-19, change needs to happen at the systemic level, including:
- Federal, state and local policies to stabilize tenants and homeowners in neighborhoods with high rates of COVID-19.
- A living wage that reflects the true cost of housing, child care, health care and higher education.
- Access to affordable housing, child care, health care and higher education as a right, funded by a fair and equitable tax structure.
- Paid sick leave so that people can afford to stay home, when they or a family member is sick.
- A public bank that will achieve cost savings, strengthen local economies, support community economic development and address infrastructure and housing needs for localities.
- Fair lending testing of all financial products, with enforcement and monetary consequences for financial institutions that discriminate against Black and Brown communities.
- Land use policies that foster the development of affordable family housing, including allowing multifamily housing in residential areas, and reduce permitting complexity.
- Affirmatively supporting the creation and sustainability of community land trusts.
