Three out of four neighborhoods marked “hazardous” by a federal agency 80 years ago are still struggling economically, a new study shows.
The study, by the National Community Reinvestment Coalition, shows that racial and economic segregation of neighborhoods in cities today reflect discrimination entrenched in local housing markets in the 1930s.
The study compared discriminatory maps drawn in the 1930s by the federal Home Owners’ Loan Corporation (HOLC) with current neighborhood income and race data. The study found lower incomes, more minorities and signs of gentrification in neighborhoods marked by HOLC as “hazardous.”
- NCRC Report: The persistent structure of segregation and economic inequality
- Interactive: View and download maps for 114 metropolitan areas
- Reversing the red lines: Disinvestment in America’s cities
- Download full report (PDF)
From 1935 to 1939, government surveyors interviewed local officials and bankers in 239 cities to document what local lenders considered credit risks in different neighborhoods. The surveyors considered a variety of factors, including access to transportation and the quality of the housing. But a primary driver of the grading system was the racial and ethnic makeup of the neighborhood’s residents.
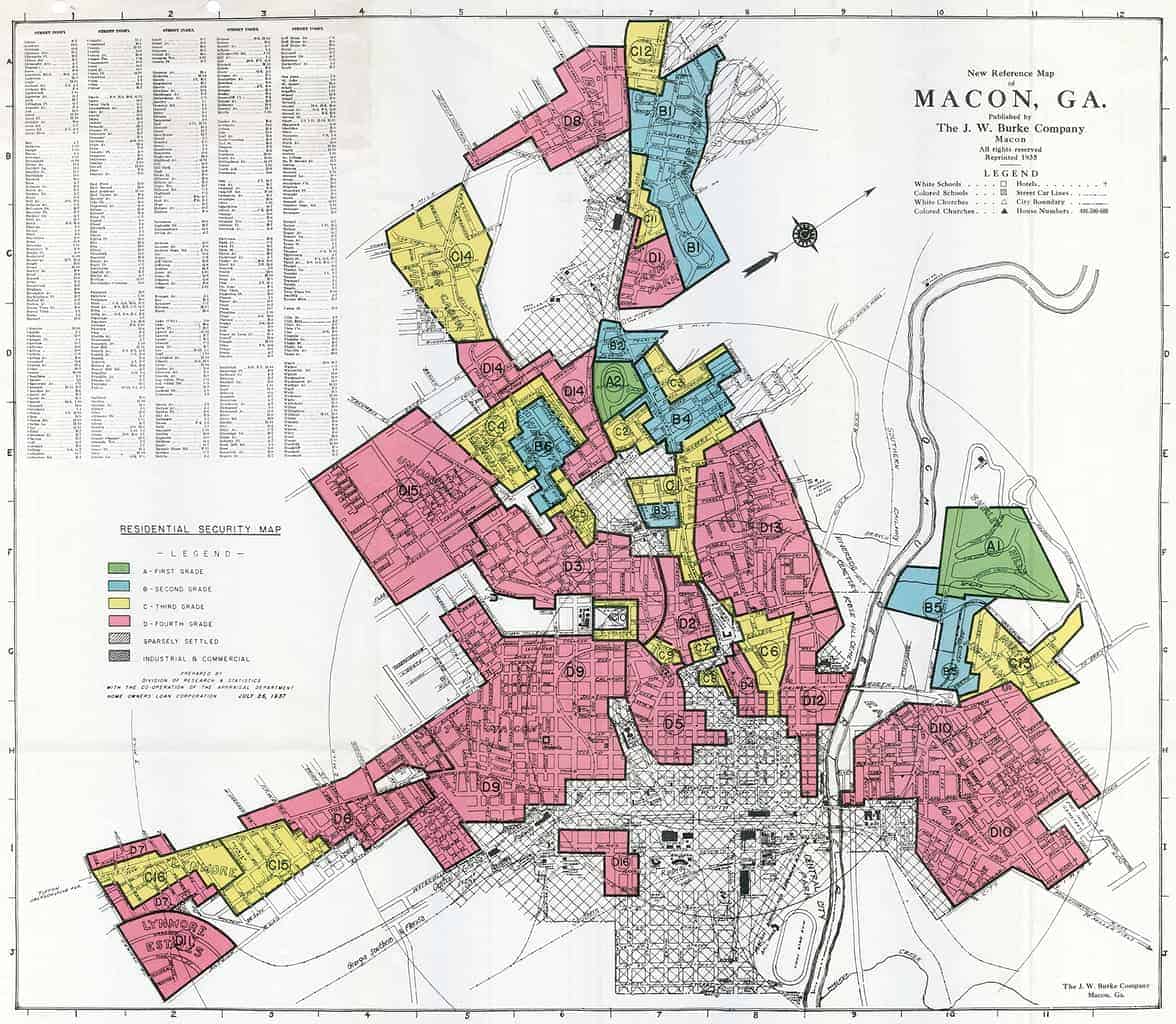
The agency marked entire communities in red ink where they deemed the influx of racial and ethnic minorities as credit risks. The maps are still known for those red lines and “redlining” is now a modern term for discrimination in housing and lending.
The HOLC maps show how local banks defined credit risks based on neighborhoods rather than on an individual’s ability to repay a loan. In short, they documented institutionalized discrimination. Today, they graphically display how racism was embedded into the structure of American cities from at least the 1930s until 1968, when the Fair Housing Act abolished redlining and banned racial discrimination in housing.

That discrimination had a profound impact on the segregated structure of cities, the rise of suburbs as the American middle class moved away from central cities after World War II and the long-term wealth gap between whites and minorities.
[jotform id=”202046038655048″]
Today, the typical black family has just 8 cents of wealth – meaning bank savings, investment holdings or home ownership equity – for every dollar of wealth accumulated by their white neighbors. Today, 65% of “majority minority” communities are still in neighborhoods graded “hazardous” in the 1930s and colored red on HOLC maps. In these neighborhoods, credit, the lynchpin of economic mobility, became either unavailable or very expensive. In contrast, neighborhoods given the highest grade in the 1930s, marked in green, are today 91% upper income, and almost entirely white.
“Growing up in the U.S., some of us learn that race-based policies of the past impacted American public life in obvious ways, resulting in segregated schools, buses, and restaurants”, said Bruce Mitchell, a senior research analyst at NCRC and co-author of the study. “What isn’t so obvious is how policies and practices of racial and ethnic discrimination, both by our government and institutions, impact our cities today. Tackling economic inequality in the 21st century requires grappling with disinvestment in “redlined” neighborhoods so that we can address the foundation of segregation and economic inequality visibly evident today.”
The new study compares the historic HOLC maps with 2010 Census and other government data on neighborhood income and race. The resulting maps visualize a central argument in author Richard Rothstein’s 2017 book, The Color of Law: A Forgotten History of How Our Government Segregated America that the economic status of a “red” neighborhood and a “green” neighborhood today is partly attributable to the depth of government-sanctioned racial and ethnic discrimination in home lending starting in the 1930s.
“Until we arouse in Americans an understanding of how we created a system of unconstitutional state-sponsored, dejure segregation, and a sense of outrage about it, neither remedies nor reparations will be on the public agenda,” Rothstein said in his book.
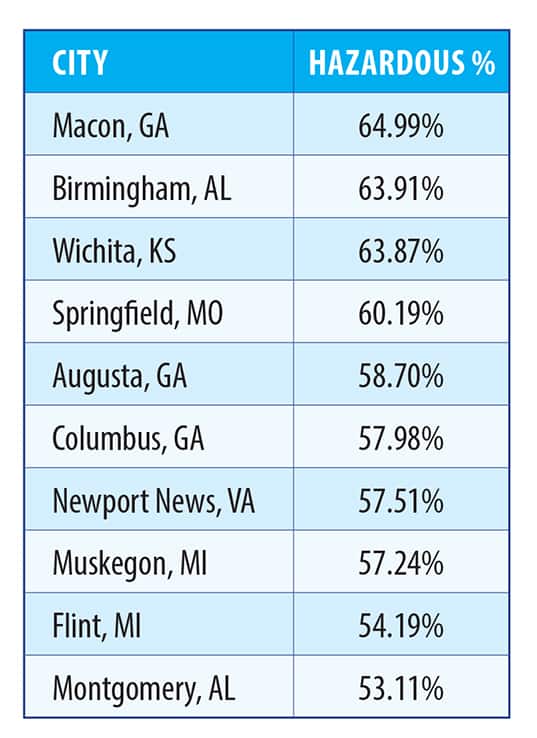
The enduring legacy of redlining is especially dramatic in the 10 cities with the most neighborhoods graded “hazardous.” Today, they remain “hypersegregated.”
Eight of those cities were in the South, including Macon, Georgia, the most redlined city in America. In Macon, 65% of neighborhoods were deemed “hazardous” and unworthy of credit. Today, 1 in 4 residents of Macon County are still below the poverty line, and that rate is 2.5 times higher among black residents.
The implications of the NCRC study are both daunting and hopeful for urban planners, policymakers, the financial sector and civic leaders. The study shows how policies that influence access to capital and credit can have a lasting impact on housing patterns, the economic health of neighborhoods and who accumulates wealth – for decades. That means new policies to boost access to capital, including in low- and moderate-income communities can also have a lasting impact.
But the study also shows, in maps and with data, how discrimination and segregation can endure.
“What I found truly shocking about this work wasn’t necessarily the finding that redlining existed, but where it existed there are lasting impacts almost a century later,” said Jason Richardson, Director of Research at NCRC. “It’s as if time stood still in some of these places, locking people into neighborhoods of concentrated poverty.”
- NCRC Report: The persistent structure of segregation and economic inequality
- Interactive: View and download maps for 114 metropolitan areas
- Reversing the red lines: Disinvestment in America’s cities
- Download full report (PDF)
Photo by Jesse Meisenhelter


