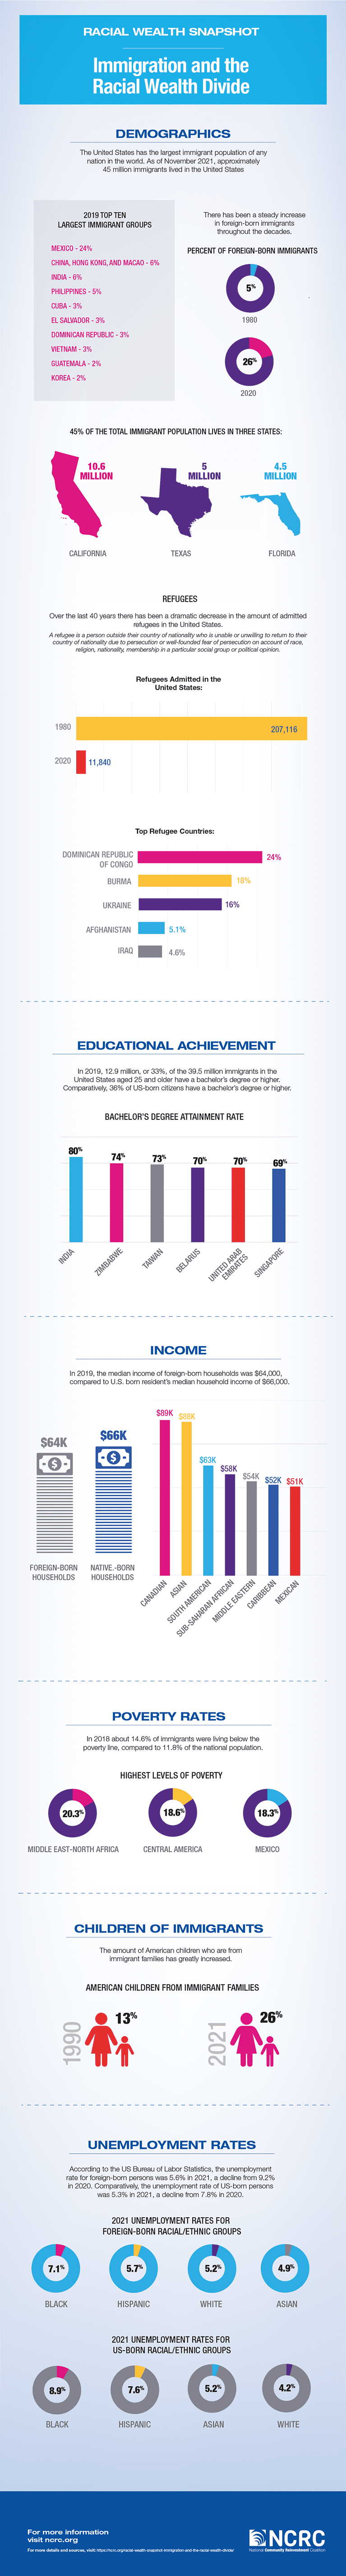
Demographics
In 2019, nearly 45 million foreign-born immigrants accounted for 14% of the national population in the United States. One in seven US residents is an immigrant and one in eight US residents have at least one immigrant parent in their household. There has been a steady increase in foreign-born immigrants throughout the decades. In 1980, foreign-born immigrants accounted for only 5% of the US population. According to the 2020 Current Population Survey (CPS), immigrant parents and their US-born children make up 85.7 million of the US population, or around 26% of the US population.
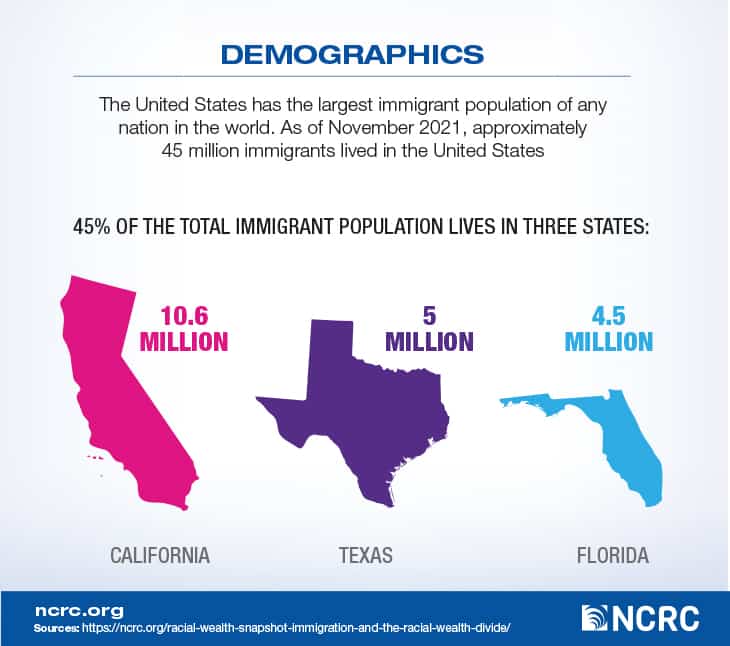
In 2019, Mexicans comprised 24% of the total immigrant population, remaining the largest immigrant group. The next two largest immigrant groups come from China and India, each accounting for 6% of the total immigrant population. The other top countries of origin are the Philippines (5%), Cuba (3%), El Salvador (3%), the Dominican Republic (3%), Vietnam (3%), Guatemala (2%), and Korea (2%). 45% of the total immigrant population lives in three states: California with 10.6 million, Texas with 5 million, and Florida with 4.5 million. The other two states with millions of immigrants are New York with 4.4 million and New Jersey with 2.1 million, according to the Migration Policy Institute.
Naturalization
Citizenship can benefit immigrants by granting certain rights and offering more stable employment and better job opportunities. Among the 44.9 million immigrants recorded in 2019 Census data, 844,000 were naturalized, an 11% increase compared to 2018. In 2020, 628,000 people naturalized, a 26% decrease from 2019. And in 2021, 809,000 immigrants applied for naturalization.
The naturalization law was first established in 1790, stating that any free, White, adult alien, male or female, who resided in the US for two years could be granted citizenship. Though the naturalization law had different requirements during different periods, the ultimate goal was for the country to determine what types of people were to be granted citizenship to the United States. It is important to note that immigration for the purpose of citizenship was greatly limited to almost solely European immigrants until the latter half of the 20th century. The Immigration Act of 1924 restricted immigration and naturalization to Northern and Western Europeans, limiting European immigration, almost completely shutting out Asian immigrants and reinforcing barriers for the rest of the world. These restrictions on immigration caused a sharp decline in immigrants from 350,000 to 165,000 in the 1920s. This number didn’t rebound until after the mid-20th century, thanks to the Black Freedom Struggle of the 1950s and 1960s and the passage of the Immigration and Nationality Act of 1965. This 1965 law allowed for greater immigration from non-European countries and is accountable for the US’s highly diversified immigrant population.
In 2000, nearly 889,000 people were naturalized, compared to 2005 and 2010, when 604,000 and 620,000 people applied for citizenship. The weakened economy of the 2000s, with the 2001 recession followed by the 2008 Great Recession, was a major cause of the decline in immigration and naturalization. Additionally, in 2007, the fee for the naturalization application was raised by 80% from $330 to $595 for adults and from $255 to $460 for children. This increase was a burden to low-income immigrant families. Yet years after the Great Recession, there was a gradual return to the 2000s level of immigration. In 2015, nearly 730,000 immigrants were naturalized. This increased to 844,000 naturalizations in 2019. The coronavirus pandemic caused a brief dip to more than 625,000 naturalizations in the 2020 fiscal year, but in 2021 the rate of naturalizations went back up to a little more than 800,000, getting closer to the 2000 level of naturalization.
Refugees
Over the last 40 years there has been a dramatic decrease in the amount of admitted refugees in the United States. In 1980 there were 207,116 admitted refugees in the United States; By 2020 there were only 11,840 people declared refugees in the United States, including 5,142 people considered principal refugees – a term for individuals directly granted a refugee status – and 6,698 considered derivative refugees, children of principal refugees who petitioned for refugee status within two years of their parents admission. According to the Department of Homeland Security (DHS), the top countries of origin for individuals seeking a refugee status are the Democratic Republic of the Congo (24%), Burma (18%), Ukraine (16%), Afghanistan (5.1%), and Iraq (4.6%). Due to the COVID-19 pandemic, only 29,926 people were declared refugees in the United States in 2019. And due to the travel restrictions, such as reducing international flights between countries, the US Refugees Admissions Program (USRAP) deferred the arrivals of refugees from March 19 to July 29, 2020. While the Trump administration capped refugee intake for the year at 18,000, only 11,000 actual refugees were granted formal status.
Upon coming into office President Joe Biden prioritized and increased immigration protections. The Biden administration has extended temporary protections for 475,000 Afghans, Burmese, Ukrainians, and Venezuelans who are currently living in the United States.
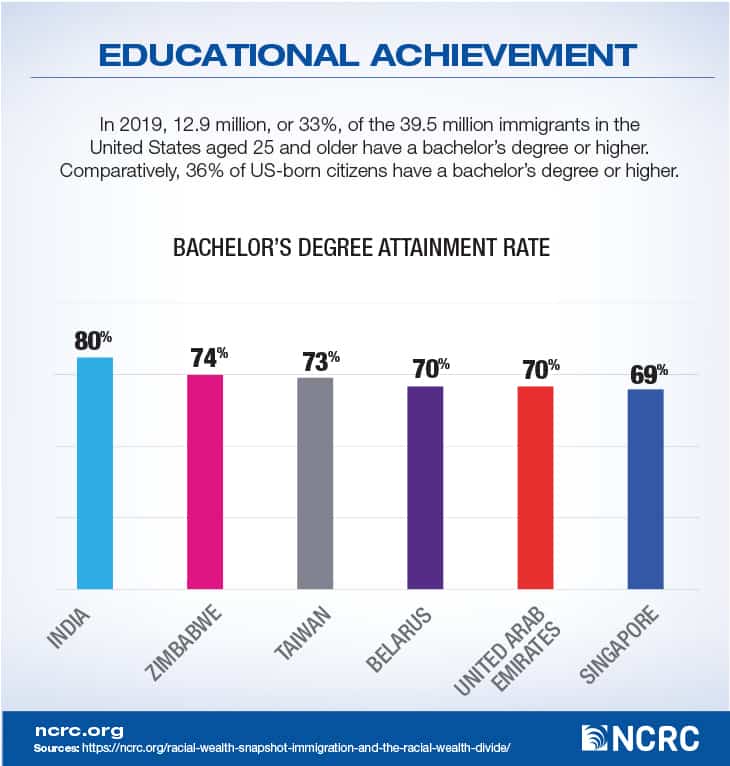
Education
According to the 2019 American Community Survey 1-Year Estimates, there are 12.9 million immigrants aged 25 and older who have a bachelor’s degree or higher. That is 33% of the total 39.5 million immigrants aged 25 and up. Comparatively, 36% of US-born citizens have a bachelor’s degree or higher. Among immigrant groups, India has the highest share of college-educated immigrants: Nearly 80% of immigrants from India had a bachelor’s or higher in 2019. The other highly educated origin countries are Zimbabwe (74%), Taiwan (73%), Belarus (70%), the United Arab Emirates (70%), and Singapore (69%).
Poverty
About 14.6% of immigrants were living below the poverty line in 2018, compared to 11.8% of the national population. The Federal Poverty Line was defined in 2018 as an annual income of $25,701 for a family of four; Such families are considered impoverished if they earn less than $2,142 per month, $494 per week or $70 per day. The leading group among immigrant countries of origin who live under the poverty line in 2018 are Middle East-North Africa (20.3%), Mexico (18.6%) and Central America (18.3%).
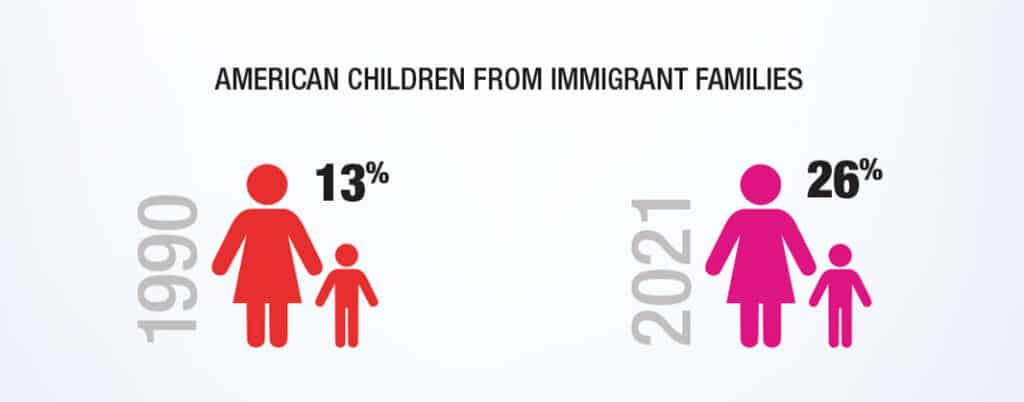
Children of Immigrants
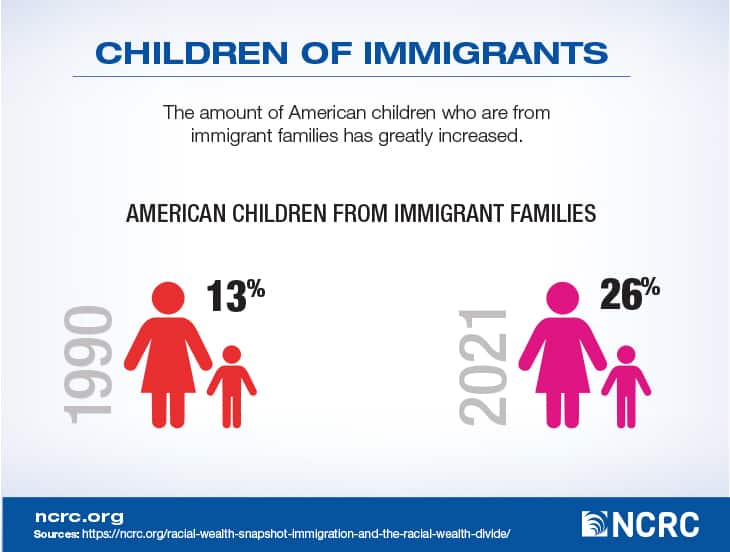
The amount of American children who are from immigrant families has greatly increased. In 1990, 13% of American children were from immigrant families. This representation has since doubled: About 26% of American children were from immigrant families as of 2021. Children from immigrant families have a much higher poverty rate at about 21% compared to children from nonimmigrant families who have a 10% poverty rate. The paper “Including Children in Immigrant Families in Policy Approaches to Reduce Child Poverty” notes, “More than 90% of children in immigrant families are US citizens, but they are excluded from the safety net due to restrictions that affect their parents and other family members [and] limit the ability of both existing and enhanced social programs to reduce child poverty[.]”
Unemployment
According to the US Bureau of Labor Statistics, the unemployment rate for foreign-born persons was 5.6% in 2021, a decline from 9.2% in 2020. Comparatively, the unemployment rate of US-born persons was 5.3% in 2021, a slight decline from 7.8% in 2020. Despite the numerical decline, the unemployment rate still remains above pre-pandemic 2019 levels. In 2021, the unemployment rate of foreign-born men decreased by 2.9% from 2020 to 5.5%, and foreign-born women decreased by 2.9% from 2020 to 6.1%. In comparison, the unemployment rate of US-born men decreased by 2.3% from 2020 to 5.5%, and US-born women decreased by 2.9% from 2020 to 5% in 2021. Among the foreign-born racial/ethnic group, Black immigrants have the highest unemployment rate with 7.1% in 2021, followed by Hispanics (5.7%), Whites (5.2%), and Asians (4.9%). Among the US-born, Black Americans continue to experience the highest unemployment rate (8.9%), followed by Hispanics (7.6%), Asians (5.2%), and Whites (4.2%). The Omicron wave perpetuated an already unsteady employment market that continued unemployment disparities between foreign-born and US-born residents. Even though the unemployment rate has dropped, unemployment has not returned to pre-pandemic levels.
Income
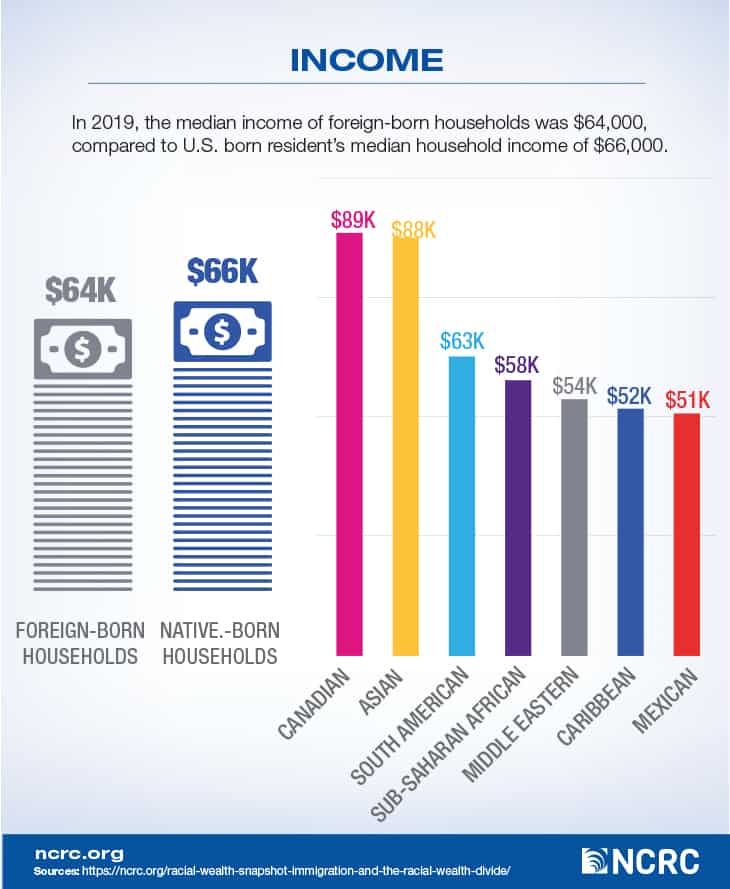
In 2019, the median immigrant household income was $64,000, compared to $66,000 for the median US-born household. The median household income of immigrants is dispersed, with the largest median income going to Canadian immigrants with an average of $89,000 in 2019. Followed by Asian households ($88,000), South American households ($63,000), sub-Saharan African households ($58,000), Middle Eastern households ($54,000), and Caribbean households ($52,000). Mexican immigrant households have the least median annual income at $51,000.
In 2019, Black immigrants had a median household income of $54,700, with the overall immigrant household income at $58,600. Comparatively, the US-born Black household median income was $42,500. Despite income differences between native-born and foreign-born Black Americans, college attainment among the two groups is similar. Nearly one-third of the Black immigrants aged 25 and older have at least a bachelor’s degree, compared to 29% of Black Americans aged 25 and older who held at least a bachelor’s degree in 2019.
South American immigrants have a median income that reflects the average income for Americans as a whole and American immigrants as a whole. In 2019, the median household income for South Americans was $63,000, compared to $64,000 for all immigrants and $66,000 for the US born. Two of the largest immigrant groups, Mexican and Central Americans, have substantially lower median annual incomes than immigrants as a whole, with a median annual income of $51,000 for both. Regarding education, in 2018, about one-quarter of recent-arrived Latino immigrants aged 25 and older had at least a bachelor’s degree or higher education, including Spain (80%), Venezuela (65%), and Argentina (64%). 41% of immigrants from Columbia, 34% of immigrants from Peru, 11% of immigrants from Central America, and 8% of immigrants from Mexico had a bachelor’s degree or higher.
In 2019, the median income for Asian immigrants was $88,000, slightly higher than US-born Asians ($85,000), and $29,400 higher than the overall immigrant household income. However, there are wide disparities in income among Asian origin groups. Indians earned a median of $119,000 and Filipinos earned a median of $90,400 as their annual household income. Notably, the lowest median household income groups within the Asian immigrant population are Nepalese ($55,000) and Burmese ($44,400). There is not only a disparity in income, but also in education. 75% of Indians, 65% of Malaysians, 60% of Mongolians, and 60% of Sri Lankans have at least a bachelor’s degree. Comparatively, only 18% of Laotians and 15% of Bhutanese have at least a bachelor’s degree in 2019. Immigrants who earned a bachelor’s degree in their home country are more likely to come to the United States through a high-skilled worker’s visa. Asian immigrants account for 57% of the total Asian American population in the United States, so data on Asian immigrants reflect the data for the majority of Asian Americans as a whole.
Canadian immigrants also have a higher median annual income than the total immigrant group and US-born. In 2019, the median household income of Canadian immigrants was $89,000. Regarding education, 51% of the Canadian immigrants aged 25 and older have at least a bachelor’s degree, compared to 33% of the foreign-born and US-born.
Work visas and immigrant professions
In the past decade, the United States admitted 10.3 million individuals under the Lawful Permanent Resident status (LPR). 62% of people granted LPR status already lived in the US with another visa or status. Among those with LPR status, 63% of people are granted by family-sponsored categories, and 21% of people are granted by employment-based categories. In 2020, the United States granted the lowest number of LPR status in 17 years. The US approved LPR for 707,000 people, a 31% decrease from 1.1 million people in 2019. The largest group of new LPRs is from Mexico (14%), followed by India (6.6%), and mainland China (5.9%).
Due to COVID-19, there was a delay in visa processing. The US consulates and embassies around the world have postponed each country’s visa processing in response to coronavirus surges. Processing times for the Application to Register Permanent Resident or Adjust Status (I-485) climbed by a staggering degree compared to the prior year. In January 2020, around 75,000 cases were requested to be processed; By February 2021, over 6 times the number of cases (roughly 473,000) were waiting for action.
The temporary visa is for people who travel to the United States for a temporary purpose, including tourists, international students, exchange program attendants, business travelers, and temporary workers. In 2021, 2.8 million such nonimmigrant visas were issued. Short-term visitors, including temporary business and tourist visas who hold B and BCC visas, accounted for 30% of nonimmigrant visas. F and J visa categories, including international students, exchange visitors and their family members have accounted for 19% of temporary visas. H Visa categories for temporary workers and their family members have comprised the third largest group of nonimmigrant visas, only 17% of its visa distributed in 2021. The top ten countries to obtain nonimmigrant visas in 2021 were: Mexico, India, mainland China, Columbia, Ecuador, Japan, Israel, the Philippines, the Dominican Republic, and Peru. The first three countries make up 46% of the 2.8 million nonimmigrant visas. These 10 countries in total make up 63% of all nonimmigrant visa requests. Mexico was the top country for nonimmigrant visas from 2000 to 2013. However, China has since taken the lead as tourism from China increased. In 2015, 2.6 million tourist visas were distributed to Chinese nationals. Another factor is the plurality of international students enrolled in the US higher education system are from China. In the 2019-2020 academic year, up to 35% of all international students in the US were coming from China. Large numbers of international students are also coming from Brazil, Canada, India, Japan, Mexico, Saudi Arabia, South Korea, Taiwan and Vietnam.
The diversity visa lottery is a random draw from countries with low immigration to the United States. Lottery winners must obtain a high school education or proof of 2 years of work experience within the past 5 years in an occupation that requires at least two years of training or experience. The winners need to pass a medical exam and background check to be successfully granted the status. 6.7 million people have filed for the DV-2021, representing 11.8 million potential immigrants after accounting for applications filed for spouses and children. In 2020, people who obtained a green card through the diversity visa lottery accounted for 4% or 70,700 new LPRs. In 2020, 14% of recipients were from Nepal and the Democratic Republic of the Congo. Other top countries were Egypt (6%), Russia (6%), Albania (5%), Ukraine (4%), Sudan (4%) and Algeria (4%).
In 2019, there were 28.4 million employed immigrant workers in the United States, meaning that immigrants made up 17.4% of the total US worker population. The primary employer industries for this group were agriculture, forestry, fishing, and hunting (26%), management and professional occupation (23%), construction (22%), other services (20%), transportation and warehousing (19%) and accommodation and food services (19%). In 2018, Asian and White immigrants were more likely to work in high-skill jobs: 43% of Asian immigrants and 36% of White immigrants used to work as chemical engineers and computer programmers. In contrast, only 23% of Black immigrants and 11% of Latino immigrants worked in that same industry. Black immigrants have a higher chance to work in high-analytical and high-fundamental skill occupations, such as research than Hispanic workers. Hispanic immigrants are more likely to be employed in mechanical-skills occupations, such as repairers. In 2018, 54% of employed Hispanic immigrants worked in the mechanical-skills industry compared to other groups.