This is one in a series of racial wealth snapshots. See more here.
As Latino Heritage month begins on September 15, NCRC is kicking off a series exploring Latino economic health and wealth, beginning with an updated Latino Wealth Snapshot. This snapshot is a landscape evaluation of recent trends in Latino income, poverty rates, homeownership and net worth pre-COVID. Subsequent pieces and infographics will dive into COVID’s impacts on housing trends among Latino renters and homeowners, the Latino workforce and employment sectors, and Latino entrepreneurship.
The data in this snapshot focused on data from 2019 before the COVID-19 pandemic occurred. The ramifications of COVID-19 are continuously unfolding and data sources are still limited. In subsequent Latino wealth snapshots, a speculative look will examine COVID-19 effects on assets and economic trends such as in housing and the labor force.
Defining Latino
In census data, Hispanic is the term most often used to describe the ethnicity of people in the United States from Spanish-speaking countries. However, it is most often thought of as a person from or has ancestry in Latin America, excluding people from Spain.
The term Latino, shorthand for “Latinoamericano,” refers to any individual born or descendant from countries in the Americas (including the Caribbean) that widely speak Latin-based languages such as Spanish in Mexico, French in Haiti or Portuguese in Brazil. In this publication, we use the term Latino because of our focus on people from Latin America. Yet, the data we share most often solely derives from people born in or have ancestry from Latin American Spanish-speaking countries, most often excluding Haitians and Brazilians.
Demographics
Latinos are the largest community of color and fastest-growing native born demographic in the United States.
In 2000, there were about 35.7 million Latinos in the United States. By 2010, the population grew 42% to 50.5 million. Over the past decade, the Latino population grew an additional 23% — from 50.5 million to 62.1 million. This represents 18.7% of the current US population. Latinos accounted for about half (51.1%) of the total population growth of the United States between 2010 to 2020. As of July 2021, the US Census’s Current Population Survey (CPS) estimated that about 60.5% of Latinos are of Mexican descent, 9.2% are Puerto Rican, 6.8% identify as South American and 6.6% identify as Central American.
Young Latinos are the fastest-growing demographic and many have a greater propensity to access wealth-building enablers, such as post-secondary education, than older generations. Between 2010 and 2019, the Latino population added 10 million people to the total population, 2.2 million of which was solely driven by Latinos under the age of 25.
Debt, Inheritance, Wealth & Homeownership
In 2019, the median wealth of a Latino household was approximately $14,000, a mere 9% of White households’ median wealth of $160,200. Since 1983, Latino households’ median net worth has been 2% – 6% of the wealth of non-Hispanic White households, with the wealth divide between the two peaking in 1989, in which non-Hispanic White households’ median wealth was $129,000 while Latino households had a median wealth of $2,700. In 2019, the homeownership rate for Latino Americans was 47.5%, much lower than the national homeownership rate of 64.9% and much lower than the non-Hispanic White American homeownership rate of 73.4%. Latino homeownership fluctuated between 45% and 49% between 2000 and 2020. However, Latinos have accounted for over 50% of US homeownership growth in the past 10 years. Nearly one in three Latinos is within the “prime homebuying years” of 25 – 44, meaning this age group will likely drive the projected Latino homeownership growth over the next 20 years.
This wealth disparity corresponds with a strong inheritance disparity. In 2019, only 5% of Latinos reported receiving a type of monetary or estate inheritance, while 26% of non-Hispanic Whites claim such financial background.
In 2019, Latino households carried a lower median debt value compared to other demographic populations. Latino households owed a median debt of $30,000, Black households owed $31,400, and White families owed the highest debt at $74,100. This example illustrates that the wealth disparity in the United States is based on assets rather than pending liabilities. Though Latinos carry lower levels of debt, Latinos have to apply a higher portion of their lower-income toward debt payment.
Educational Attainment
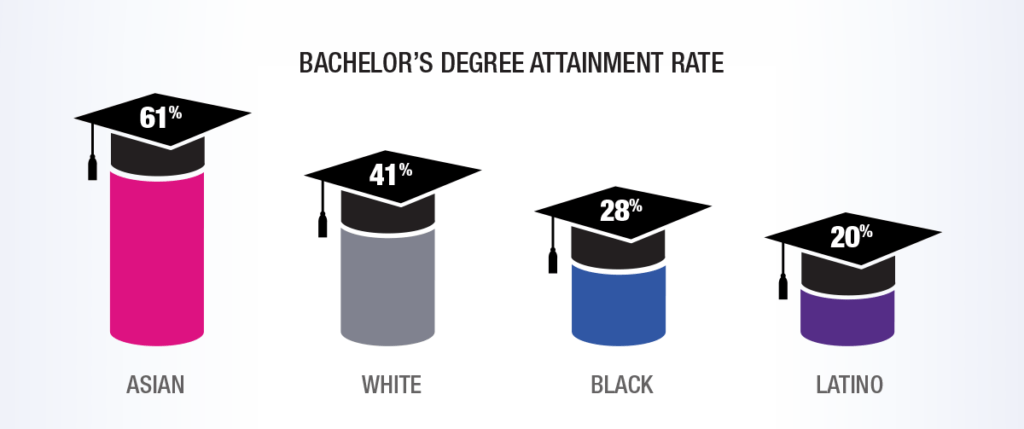
Latinos have the lowest attainment of bachelor’s degrees or higher of the major racial/ethnic groups in the United States. According to US Census Bureau 2020 Current Population Survey’s Annual Social and Economic Supplements, only about 20% of Latinos aged 25 years or older had a bachelor’s degree or higher. In contrast, 41% of Whites, 28% of African Americans and 61% of Asian Americans had a bachelor’s degree or higher.
In 2017, US-born Latinos aged 25 or older had higher educational attainment than their foreign-born counterparts. However, Latinos who have immigrated within recent years have higher education levels than previous immigrants. About 26% of Latinos 25 years and older who immigrated to the US between 2012 – 2018 had a bachelor’s degree.
Furthermore, although educational attainment for Latinos is below the national average, it has been increasing among younger Latino populations (and those with Bachelor’s degrees have 48 times the net worth of those with a high school diploma). Bachelor’s degree attainment among Latinos 25 and older has increased by 70% since 2001, pointing to greater opportunity for this millennial and younger Gen-X generation to build wealth.
Income
The United States’ Latino population is growing, and to this day, it is still one of the most socioeconomically insecure. In 2019, Latinos had a household median income of $56,113 — 30% less than the White household median income of $76,057, and 20% less than the overall household median income of $68,703.
US Born Latinos Compared to Foreign Born Latinos
The share of the Latino population which is foreign-born has declined by about 7 percentage points over the past 20 years — from 40% to 32.7%. For comparison, the overall share of the foreign-born US population has slightly increased by 2.6 percentage points over the past two decades.
When comparing the individual income of foreign- vs. native-born Latinos, we find a surprising result. The foreign-born Latinos’ individual median income from the start of the Great Recession in 2007 throughout recovery in 2017 rose 17% ($24,200-$28,300). Meanwhile, native-born Latinos’ individual median income saw a loss of 6% ($32,000-$30,000) during that same time period. Over the decade of post-Great Recession recovery, native-born Latino income levels failed to rebound to pre-Great Recession levels while foreign-born Latinos achieved near parity with the low-median income levels of their native-born counterparts.
Poverty Rates
Overall, Latino poverty rates have been on the decline over the past 40 years, aside from inflections mirroring national poverty trends such as in 1995 or in the wake of the great recession. Latino poverty rates have been on a significant decline since 2010, decreasing from 26.5% to 15.7% in 2019. Despite this continual decrease in Latino poverty rates, a 15 to 20 percentage point gap in poverty rates has persisted between Latino and White individuals, with this gap peaking in 1996 at 21 percentage points. In 2019, the poverty gap between Latino and White individuals narrowed to 8.4 percentage points.
Employment And Unemployment
The Latino unemployment rate fluctuated in a downward projection from 5.8% to 4.3% between the period of January 2017 to June 2019. Meanwhile, the national unemployment rate in 2019 dropped to one of its lowest rates at 3.7%. The Bureau Of Labor Statistics 2019 data showed that native-born Latinos had an unemployment rate of 5.1%, whereas foreign-born Latinos had a lower rate of 3.4%. The reason for the difference in employment rates between foreign-born and native-born Latino individuals is unclear though there is growing research in this area that points to migrants leaving the workforce and even the country when experiencing unemployment. Considering labor participation rate, White Americans’ 63% participation rate reflects that of the country as a whole and is very close to the African American labor participation rate. Latinos have the highest labor force participation rate (LFPR) of 66.8%, due in large part to the relative youth of the population. For comparison, Asian Americans[1] have a labor participation rate at 64% and Black Americans[2] at 62.4%.
Latinas And Gender Inequality
Beginning with educational attainment, in 2019, Latinas over the age of 25, like women in all of the other major racial and ethnic categories except Asians, held bachelor’s degrees or higher at higher rates compared to their male counterparts (women – (20.7%), men -16.8%). However, again like women in the major racial and ethnic categories, Latinas still did not earn as much as Latino men in their communities. The US Census’ historic income tables report for 2019 found Latinas had a median income of $23,420 versus $32,285 earned by Latino males. The Bureau of Labor Statistics’ analysis of CPS data found that pre-COVID (2019), Latinas had an unemployment rate of 4.7% while their male counterparts had a 4% unemployment rate. In terms of LFPR, another valuable metric for evaluating workforce trends, Latinas’ 2019 LFPR was 57.7% while their male counterparts participated in the workforce at a much higher rate at 76%.[3] For context, the nation’s overall LFPR is 63%. In 2019, Latina women made an average of $488.25 a week for the entire fiscal year. In comparison, Latino men made an average of $556.50 a week in 2019.
Slightly more than 5% of Latinas were unemployed, and women led about 22.8% of Latino households. By comparison, 6.78% of African American women were unemployed, and women led 37.7% of African American households. Asian women have a 3.06% unemployment rate and 10.5% of Asian households were women-led. White women had a 2.8% unemployment rate and 11.6% of White households were women-led.
In terms of wealth, single Latinas, between the ages of 18 to 64, had a median wealth of only $1,200, about 20% of Latino men’s net worth and only 4% of the wealth of White men. The exceptionally low levels of wealth among Latinas — similar to other females of color — as compared to their male counterparts illustrates a need for special attention on financial wellbeing and asset accumulation across gendered lines.
[1]Bureau of Labor Statistics’ analysis of Current Population Survey data; civilian labor force participation rate for Asian. [Series LNS11332183Q], retrieved from https://data.bls.gov/PDQWeb/ln.
[2] Bureau of Labor Statistics’ analysis of Current Population Survey data; civilian labor force participation rate for Black or African American [Series LNS11300006Q], retrieved from https://data.bls.gov/PDQWeb/ln.
[3] Bureau of Labor Statistics’ analysis of Current Population Survey data; civilian labor force participation rate for Latinos, Men and women [Series LNU01300010Q & LNU01300011Q], retrieved from https://data.bls.gov/PDQWeb/ln
