This is one in a series of racial wealth snapshots. See more here.
Whiteness and white supremacy
The idea and identity of whiteness in America has long been constructed, remodeled and refitted. Used as a tool to exclude and oppress, to be identified as White was, and is, a way to gain access to privileges. The Naturalization Act of 1790 offers an insight into the foundational relationship between White identity and America: it restricted citizenship to only free White men, leaving out women, indentured servants, slaves and indigenous people. Importantly, citizenship was not just about legality in regards to rights and ability to stay in America, but it also signified status and privileges.
Since the Naturalization Act of 1790, “whiteness” and who belongs in that category has been challenged and reconsidered. Still, the construct and exclusionary nature of “whiteness” prevailed, and people fought and took to the court to be considered White. In 1922, Ozawa v. United States showcased Takao Ozawa, a Japanese man who was born in Japan but resided in the United States for 20 years, claiming that Japanese people were “free White persons” and thus, should be eligible for naturalization. The court ruled that Japanese people were not of the Caucasian race in ordinary usage, and would not be considered “free White persons,” resulting in their exclusion from citizenship. The following year, an Indian Sikh man, Bhagat Singh, appeared in front of the Supreme Court in Thind v. United States, where the court contradicted the logic behind its ruling in Ozawa v. United States. The Supreme Court acknowledged that as an Asian Indian man, Thind would have been categorized as Aryan or Caucasian, according to the prevailing race science at the time. Although Thind would be recognized as Caucasian, the Supreme Court ruled that he would not be considered “White” in the eyes of the “common man,” despite scientific race categories, and therefore was ineligible for citizenship. These two court cases showcase the lengths to which people fought to be recognized as White as a way to gain access to privilege, specifically citizenship, and also demonstrated the flimsiness behind the concept of what “whiteness” is. On one hand, White was to be strictly defined by race science, on the other, White was defined by “common sense” by the “common man.”
Today, understanding the history of race in America is as important as ever. As with every race, White identity is a construct, one that has a historical background that points to ambiguity in the definition. Acknowledging the long history of “whiteness” in America and the many times it was redefined, expanded then constricted, shows that it is not biology, but an ideology in identity. As noted, White identity has a long history of construction and redefinition. Understanding whiteness as a construct and its effect on socio-economic realities that still exist today is central to understanding racial economic inequality.
Wealth
White families have the highest median wealth out of any major racial/ethnic group in the United States. A study investigating wealth inequality between Blacks and Whites in 2019 found that the White median household held $188,200 in wealth, which was 7.8 times that of the typical Black household of $24,100. According to the Federal Reserve, Hispanic median wealth was $36,100 and the other category, which includes Asian Americans, Indigenous peoples and those identifying as more than one race, was about $60,000. With consideration to the Black-White wealth gap, it varies across gender. When factoring in age and gender, we see continued disparities between African American and White households in this 2019 report. The survey’s microdata has the median wealth of single White men under the age of 35 ($22,640) being 3.5 times greater than single White women’s median wealth ($6,470). Additionally, single White men’s median wealth was 14.6 times greater than single Black men ($1,550) and 224.2 times greater than single Black women ($101).
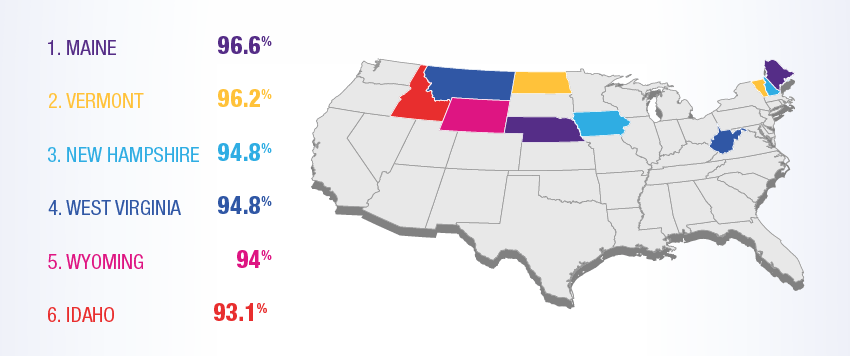
Demographics
According to the World Population Review released in 2020, the top ten states with the highest White populations in America are Maine (96.56%), Vermont (96.15%), New Hampshire (94.97%), West Virginia (94.83%), Wyoming (93.98%), Idaho (93.07%), Iowa (92.22%), Montana (91.53%), Nebraska (89.77%) and North Dakota (89.37%). According to the 2019 U.S Census Bureau, 76.3% of the national population were White. The Pew Research Center reported that the non-Hispanic White population is expected to decrease by half by the midcentury while other groups continue to grow.
Whites comprise 90% of the suburban and small metro counties and 89% of rural counties, but their populations in urban areas have diminished since the 2000s. The report highlights that urban and suburban counties are becoming more racially and ethnically diverse at a faster speed than rural areas. Moreover, between the time frame of 2012 to 2016, U.S. urban counties had no racial or ethnic majority with 44% population being White, 27% Hispanic and 17% Black.
Homeownership
Based on the data collected from the 2019 U.S Census Bureau, White non-Hispanic Americans’ homeownership rate surpassed the national rate by 8.7%, reaching a 73.3% rate compared to the national U.S homeownership rate at 64.6%. According to the census, African Americans have a 42.1% homeownership rate, American Indians have a homeownership rate of 50.8%, Asian Americans have a 57.7% homeownership rate, and Latinos have a 47.5% homeownership rate. The 2015 Pew Research Center report noted how homeownership rates tended to increase for Blacks and Whites who have higher incomes and more education, however, it does not bridge the homeownership divide amongst high income or the highly educated. Where 58% of highly educated Black householders with a college degree owned their own home, the rates for highly educated Whites was 76%. In regards to the Hispanic-White gap in homeownership, it has shifted over the past couple of decades. In 1991, the gap was the widest where the Hispanic homeownership rate was 39% and Whites was 70%, leaving a 31% gap. According to our previously cited 2019 census numbers, Latinos now have a 26% gap in homeownership rates with Whites, and African Americans have the largest homeownership gap at again 31%. It is clear that White householders have had continually higher rates of homeownership across the past 30 years even with the shifts in income and education that have occurred.
Income
The United States Census Bureau, Current Population Survey, 2018, and 2019 Annual Social and Economic Supplements, reported that the 2018 median household income varied by race and ethnicity, not increasing much from 2017 nationally. Households whose head was classified as Asian or White had median incomes that were higher than the national median of $63,179. The median household income for Asian households in 2018 was $87,194, while the median household income for Whites was $70,642. Based on the 2013-2017 ACS for American Indian and Alaska Native populations, the median income was $40,315.
A 2016 U.S Census Bureau report found that, based on the ACS 2015 survey, non-Hispanic Whites had a slightly higher median household income in urban counties of $58,590 compared with rural counties whose median income was $54,178. Similarly, the Black median income in urban areas was slightly higher than that of their rural counterparts: $36,048 compared with $31,735, respectively. For Latinos, there was practically no difference between urban and rural counties, with both having Latino earnings of around $42,000. Whether in rural or urban areas, Whites have a significantly higher income than the next two largest racial/ethnic groups, African Americans and Latinos.
Since 1967, income for all racial and ethnic groups has steadily increased, but income disparity remains constant. The national median income in 2018 was $63,179; for Blacks it was $41,361, and for Whites, it was $70,642. In 1972, the national median income was $9,697, but for Blacks, it was $5,938 and for Whites, it was $10,318. This points to a continuous lack of equity in income, where although all racial and ethnic groups are earning more than they did 30 years ago, Whites still earn much more than their Back and Hispanic counterparts.
Poverty Rates
A 2016 U.S. Census Bureau Report found that the poverty rate in rural areas was lower than in urban areas with a poverty rate in rural areas at 13.3% and an urban poverty rate at 16%. When looking at the major racial/ethnic categories we find only non-Hispanic Whites have lower poverty levels in urban areas than rural. For the category, there is a 10.6% urban poverty rate compared to 11.3% rural poverty rate. American Indians have a 30.6% poverty rate in rural areas compared to a 26.9% urban poverty rate. Blacks and Hispanics have about the same poverty levels in both rural and urban areas with a Black poverty rate of 27% and a Hispanic poverty rate of 24% in both areas. Asian Americans have a 12.% poverty rate in urban areas and a 10.5% poverty rate in rural areas.
Over the past 30 years, poverty rates in the United States have fluctuated nationally, but historically, some racial and ethnic groups have consistently faced higher rates of poverty. In 2016, the national poverty rate for those aged 16-64 was 11.6%, for Whites it was 8.8%, yet for Blacks it was 18.6% and for Hispanics, 15.8%. To put it in perspective, in 1986, the national poverty rate for those aged 16-64 was 10.8%. The percentage of Whites who lived in poverty in 1986 was 7.8%, yet for Blacks, it was 24.3% and for Hispanics, 21.5%. Of course, these percentages have gone up and down over the past 30 years, but generally, Whites have a lower poverty rate than the national rate of poverty, while Blacks and Hispanics have higher rates of poverty.
Unemployment
According to the Economic Policy Institute’s 2019 first-quarter report, South Dakota had the lowest White unemployment rate at 1.6%. West Virginia had the highest White unemployment rate at 4.8%, surpassing the national unemployment rate of 3.8% during that period. Unlike African Americans and Hispanics, the White unemployment rate was at or below its pre-Great Recession level in 43 states. Tennessee had the lowest Black unemployment rate at 4.9%, Georgia had the lowest Hispanic unemployment rate of 2.4%, and Nevada for Asians at the rate of 1.4%. At the national level, Blacks had the highest unemployment rate of 6.7%, Hispanic at 4.7%, and lastly Asians at the same rate with Whites at 3.1%. Meanwhile, in 2018 for American Indian and Alaska Native population, the unemployment rate (6.6%) surpassed the national rate (3.9%).
In the early 1980s, all racial and ethnic groups experienced an increase in unemployment rates due to the recession under Reagan’s Administration, however, some groups faced a rise at a higher disproportionate rate. In 1983 the Black jobless rate rose to 21.1%, the highest spike in more than 50 years from 1962 to 2016, while the White rate rose to 9.3%. In 2015, the White unemployment rate was the second to lowest at 4.5%. The Asian rate was the lowest at 3.5%, compared with the Black unemployment rate at 10.3%. The Hispanic-White unemployment gap in 2015 was similar to what it was in 1971, where the Hispanic unemployment rate was 8.6%, 1.5 times the rate of Whites.
Educational Attainment
As reported by the U.S Census Bureau in 2019, 40.1% of non-Hispanic Whites ages 25 and older had obtained a bachelor’s degree or higher, increasing from 33.2% in 2010. At the same time, the percentage of Blacks aged 25 and older with a bachelor’s degree or higher rose from 19.8% to 26.1%, Asians from 52.4% to 58.1% and Hispanics from 13.9% to 18.8%.
Educational attainment has gradually risen nationally and for all racial and ethnic groups. In 2019, 36% of people over the age of 25 completed 4 years of college or more, compared with 21.1% in 1989. In 1989, 21% of Whites over the age of 25 completed at least 4 years of college, compared with 40.1% in 2019. For Blacks, in 1989, 11.8% completed at least 4 years of college, compared with 26.1% in 2019. Lastly, for Hispanics, 9.9% completed 4 years of college in 1989, compared with 18.8% in 2019. Overall, all racial and ethnic groups are seeing higher rates of collegiate level education attainment, but there is still a major gap between completion rates in educational attainment between different racial and ethnic groups.
